Stock markets continued to move upwards as fund inflows and higher volumes indicate renewed demand for equities. While guidance and earnings expectations were lowered for this past quarter, many companies still managed to beat analysts earnings lowered expectations. Many financial companies, including Goldman Sachs (GS) and JPMorgan (JPM), reported strong revenue increases in the fourth quarter of 2012. As we crossed above 1500 on the S&P 500, we saw some individual company shares continue to climb. We can expect some profit taking and selling after some company earnings reports are released. Of the indicators mentioned in previous articles, it is notable that the Arms Index (SPXA50R) crossed above 90 on 22 January 2013. It is rare for the Arms Index to stay above that 90 level for long, though reaching that level is not necessarily an indicator that stock markets have peaked and are about to decline. The 30 year US Treasury yield has climbed above 3.0%, though the 10 year US Treasury remains in demand with a yield still well under 2.0%. The Volatility Index (VIX), and the corresponding S&P 100 Volatility Index (VXO), which gives us an indication of risk perception of the 100 largest companies on the S&P Index, hit record low levels normally associated with boom times. While it is difficult to claim we are near a peak in the current rally, it is also difficult to see much more upside in stock markets. As we continue through earnings season, watch for adverse market reactions to earnings reports. While Apple (AAPL) is more a measure of consumer spending than they are of the overall economy, a lower guidance from the company after reporting earnings on 23 January 2013 sent shares tumbling in after-hours trading.
 One of the more unusual trends we have seen more of lately is an increase in the relative volume of Japanese Yen (JPY) in global currency markets. It is tough to know exact trading volumes, though there appears to be a substantial increase recently in Japanese Yen being converted to other currencies. Some of that has been towards US Dollars (USD), often exceeding the volume of Euros (EUR) being converted to US Dollars. One of the correlation pairs amongst carry trade movements is the Euro to Yen (EUR/JPY) trading pair. When commodities activity had a larger sway on global stock markets, the Australian Dollar (AUD) movement relative to the US Dollar (AUD/USD) held a good correlation to the S&P 500 movement. The difference lately has come from Japan, who for years issued more debt than any other developed nation. Debt to GDP in Japan is now over 230%. Compared to Greece at near 165% Debt-to-GDP, this appears to be a serious problem. Japanese people hold a far larger percentage of this debt compared to the debt holdings of any other developed country, indicating confidence in the Japanese government. Demand for Japanese debt has remained high over the last several years, which fuelled demand for Yen. The other odd factor was the central bank discount window, which allows certain investors a very high leverage after short term borrowing in Japanese Yen. About one fourth of the current Japanese budget goes solely towards payment on previously issued debt. Newly elected Prime Minister Shinzo Abe is now pushing for new infrastructure spending and ¥20.2 trillion (Yen) stimulus. Over the last few years, a strong JPY has hurt Japanese exports, so a weaker Yen might stimulate export markets. Now with new central bank stimulus, and a 2% inflation target, the Yen is falling relative to other currencies. The most likely mechanism is for the Bank of Japan to directly initiateasset purchases, including Yen denominated government and corporate bonds. There has been some grumbling about this in Europe and the United States, though with the levels of stimulus already active in those regions, we now find a global race to devalue currencies. The head of the International Monetary Fund (IMF) Christine Lagarde is unconvinced that new Japanese stimulus and inflation targets will have much of any affect beyond the near term, and does not support active currency devaluation efforts. In the short term this may work, and we can watch EUR/JPY movements to gauge some of the effectiveness. Of course with major central banks now buying sovereign debt, and throwing around money through various stimulus measures, the bond markets have been somewhat unattractive for finding yield. The one exception of note is US Treasury Inflation Protected Securities (TIPS) which continue to see high demand. The latest TIPS auction saw $15 billion of bids, pushing yields to a (negative) -0.630% for 10 year TIPS. This is an indication that expectations of inflation in the United States over the next ten years is still high. Given this rush for devaluation, it should be little surprise that funds are now flowing more into equities than bonds.
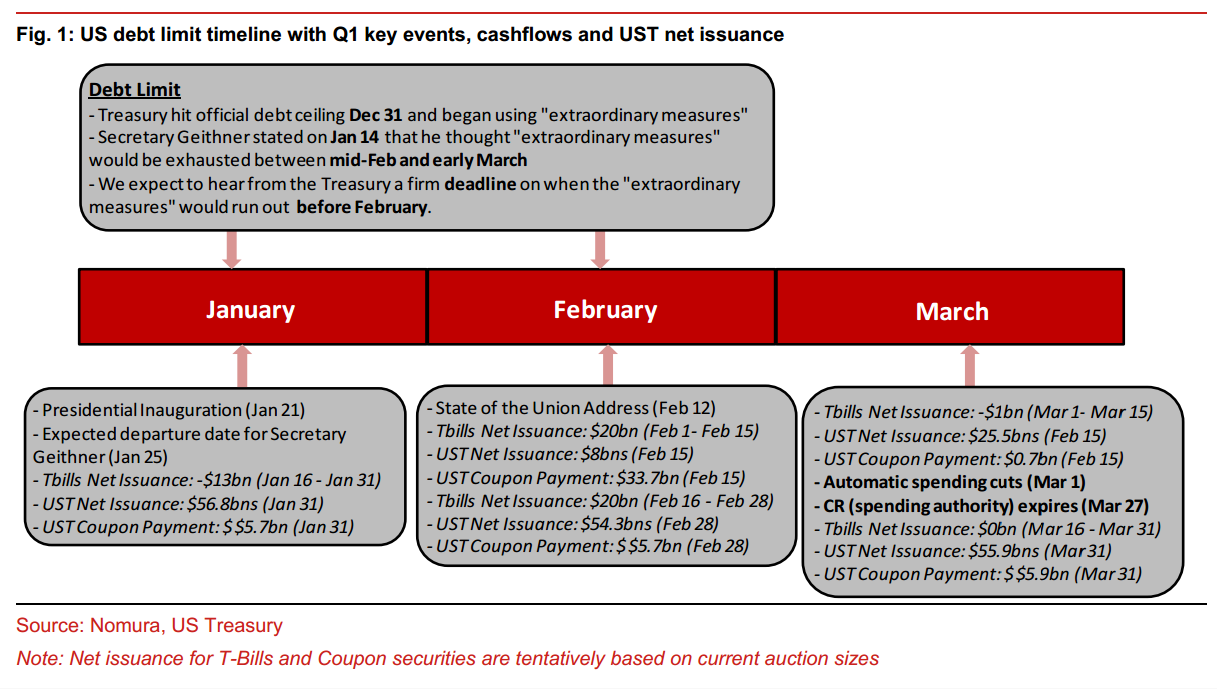 One of the events many investors have been watching is the Debt Ceiling. In an unusual move in Congress, the House of Representatives voted 285 to 144 to passed a bill to allow the Federal Government to continue borrowing through 19 May 2013. The Senate expects to pass this same bill soon. One of the provisions in this bill is a mandate for politicians to pass a budget by 15 April 2013, or face a suspension of their pay in the event they fail to meet that deadline. It's an unusual idea originally proposed around November elections, though it is more symbolic than an actual deterrent. Instead of attaching spending cuts to this bill, it is now expected that the spending cuts delayed from the beginning of this year will become the next battle on 1 March 2013. If no proposals are put forward before then, automatic spending cuts will be triggered for the military budget, funding of some Federal agencies, and cuts to some domestic spending programs. So far Fitch Ratings has indicated that automatic spending cuts on 1 March 2013 would not trigger a cut of the credit rating of the United States. Considering the self-imposed 15 April budget deadline, some of those cuts may not be in place for long. A temporary funding bill for some government agencies is set to expire on 27 March 2013, and it is unlikely that will be addressed prior to the budget deadline. With the national debt now at $16.4 trillion, this short term extension does nothing to put the United States on a path to fiscal sustainability. The United States has not defaulted on payments on US Treasuries since 1979, which was caused by politicians failing to meet a deadline at that time. Even the prospect of withholding the pay of politicians could become a hollow provision, since the House of Representatives and the Senate only need to pass their own proposals to comply, and there is no aspect of that provision requiring both houses of Congress to pass the same budget proposal. It is tough to see where any compromise may occur, and we still face a prospect of more extensions, temporary measures, and kicking the can down the road. The outcome of negotiations around these deadlines will prompt some uncertainty in financial markets, though for now politicians have temporarily moved out of the way.
Economic conditions continue to improve in the United States. Despite uncertainty around the Fiscal Cliff and Debt Ceiling, it appears that businesses and consumers recently increased spending. Economic indicators are still mixed and muted, with the recent index of consumer sentiment falling to 71.3 in December 2012, the lowest reading since December 2011. The consumer price index (CPI) came in at 1.7% in December 2012 on a year to year basis, against an expectation of 1.8% CPI. Sales of toys rebounded to top $5 billion in 2012 for the first time in three years. Rising inventories of oil and natural gas have now begun to curtail some drilling activity, as a potential oversupply would adversely lower prices. While lower oil prices would help consumers, it makes it more difficult for oil companies to continue some drilling operations, since drilling activity is mainly planned by profit potential and efficiency considerations. On an investment basis, reduced drilling activity is more likely to affect rig companies and oil services companies in the United States, as the oil majors reduce spending in the US. The Bureau of Labor Statistics released December 2012 Employment data that indicated the unemployment rate remained little changed at 7.8%. The greatest improvement in employment was in New York, while the greatest decline in employment was in California. The West continues to experience the highest unemployment rates at an average of 8.6% with the Pacific region as high as 9.2% on average. The largest year over year jobs increase occurred in Texas at 260,800 jobs added. Manufacturing continues to slowly improve with the latest Markit Research Manufacturing Purchasing Managers Index (Markit PMI) showing 56.1 against 53.0 expectations. Initial jobless claims reached 330k against 355k expected, though it should be noted that it appears the state of California did not file a report with the Labor Department. In the latest Federal Reserve Beige Book report, it is noted that all twelve districts showed increases in consumer spending at a moderate pace. Business and international travel increased tourism activity, helped by early snowfall in some parts of the United States. Manufacturing remains mixed, though transportation services saw increased volumes in six districts. Trends in wages, prices, and employment were relatively unchanged. Residential real estate activity expanded across all districts, though non-residential construction declined and demand for commercial real estate loans appears to be slowing.
One of the events many investors have been watching is the Debt Ceiling. In an unusual move in Congress, the House of Representatives voted 285 to 144 to passed a bill to allow the Federal Government to continue borrowing through 19 May 2013. The Senate expects to pass this same bill soon. One of the provisions in this bill is a mandate for politicians to pass a budget by 15 April 2013, or face a suspension of their pay in the event they fail to meet that deadline. It's an unusual idea originally proposed around November elections, though it is more symbolic than an actual deterrent. Instead of attaching spending cuts to this bill, it is now expected that the spending cuts delayed from the beginning of this year will become the next battle on 1 March 2013. If no proposals are put forward before then, automatic spending cuts will be triggered for the military budget, funding of some Federal agencies, and cuts to some domestic spending programs. So far Fitch Ratings has indicated that automatic spending cuts on 1 March 2013 would not trigger a cut of the credit rating of the United States. Considering the self-imposed 15 April budget deadline, some of those cuts may not be in place for long. A temporary funding bill for some government agencies is set to expire on 27 March 2013, and it is unlikely that will be addressed prior to the budget deadline. With the national debt now at $16.4 trillion, this short term extension does nothing to put the United States on a path to fiscal sustainability. The United States has not defaulted on payments on US Treasuries since 1979, which was caused by politicians failing to meet a deadline at that time. Even the prospect of withholding the pay of politicians could become a hollow provision, since the House of Representatives and the Senate only need to pass their own proposals to comply, and there is no aspect of that provision requiring both houses of Congress to pass the same budget proposal. It is tough to see where any compromise may occur, and we still face a prospect of more extensions, temporary measures, and kicking the can down the road. The outcome of negotiations around these deadlines will prompt some uncertainty in financial markets, though for now politicians have temporarily moved out of the way.
Economic conditions continue to improve in the United States. Despite uncertainty around the Fiscal Cliff and Debt Ceiling, it appears that businesses and consumers recently increased spending. Economic indicators are still mixed and muted, with the recent index of consumer sentiment falling to 71.3 in December 2012, the lowest reading since December 2011. The consumer price index (CPI) came in at 1.7% in December 2012 on a year to year basis, against an expectation of 1.8% CPI. Sales of toys rebounded to top $5 billion in 2012 for the first time in three years. Rising inventories of oil and natural gas have now begun to curtail some drilling activity, as a potential oversupply would adversely lower prices. While lower oil prices would help consumers, it makes it more difficult for oil companies to continue some drilling operations, since drilling activity is mainly planned by profit potential and efficiency considerations. On an investment basis, reduced drilling activity is more likely to affect rig companies and oil services companies in the United States, as the oil majors reduce spending in the US. The Bureau of Labor Statistics released December 2012 Employment data that indicated the unemployment rate remained little changed at 7.8%. The greatest improvement in employment was in New York, while the greatest decline in employment was in California. The West continues to experience the highest unemployment rates at an average of 8.6% with the Pacific region as high as 9.2% on average. The largest year over year jobs increase occurred in Texas at 260,800 jobs added. Manufacturing continues to slowly improve with the latest Markit Research Manufacturing Purchasing Managers Index (Markit PMI) showing 56.1 against 53.0 expectations. Initial jobless claims reached 330k against 355k expected, though it should be noted that it appears the state of California did not file a report with the Labor Department. In the latest Federal Reserve Beige Book report, it is noted that all twelve districts showed increases in consumer spending at a moderate pace. Business and international travel increased tourism activity, helped by early snowfall in some parts of the United States. Manufacturing remains mixed, though transportation services saw increased volumes in six districts. Trends in wages, prices, and employment were relatively unchanged. Residential real estate activity expanded across all districts, though non-residential construction declined and demand for commercial real estate loans appears to be slowing.
 In the latest data release from the National Association of Home Builders (NAHB), sentiment amongst builders has increased slightly, to the highest levels since April 2006. The NAHB note that persistently tight mortgage credit conditions, and difficulties in obtaining appraisals continue to drag on builder confidence. The NAHB Housing Market Index only considers single family dwellings, and a reading over 50 would indicate good outlook. The latest NAHB Indexreading is 47 against 48 expected by analysts. Part of the reason for home price increases has been a 17% decline in available inventory in 2012. The Mortgage Bankers Association note that mortgage applications increased 15.2 percent for the week ending 11 January 2013. Refinance activity remains at 82% of total applications. December 2012 existing home sales declined to 4.94 million against 5.10 million expected. Investor activity in housing markets has also been strong, though much tougher to track in available information. In a recent note to investors, Blackstone Group reported that they were spending about $100 million a week on purchasing houses for use as rental properties, largely through foreclosure sales and short sales. Along with Colony Capital LLC and Two Harbors Investment Corporation, Blackstone Group are creating a new asset management investment class, in an area previously dominated by small investors. This is a market that analysts at JPMorgan predict could be worth as much as $1.5 Trillion in the near future. The only point of concern is that these large private equity companies might crowd out more traditional mom and pop investors, or that they may artificially affect price levels of some real estate. The good news in this is that while the housing market is still below historical levels, we have seen continued improvements over the last three years. Housing is no longer a drag on the US economy. Even new housing starts and filings of building permits increased in late 2012. These improvements should allow housing to contribute to GDP growth in the United States in 2013.
While US housing markets continue to improve, it now appears that property prices in some parts of China are reaching bubble levels and are now unstable. In China, either housing prices need to adjust and reset drastically, or wages need to increase substantially, though the latter possibility would usher in massive inflation pressures. Demand for housing in China, especially in Beijing, has fuelled investments as China continues on a path of urbanization. Investment in residential property in China now accounts for about 14.4 of overall GDP. This level is above the housing bubble level reached in the United States several years ago. It is not easy to obtain reliable data on Chinese housing markets, though this is one area we will continue to watch this year. Chinese authorities may like the boost to GDP now, though it is highly questionable that this is sustainable for much longer. While not entirely related to this issue, it is notable that the IMF has trimmed global GDP growth projections to just 3.5% in 2013 and 4.1% in 2014, with US growth at 2.0% in 2013. Europe is expected to contract 0.2% in 2013, with several countries expected to be in recession. One of the earliest attempts by the European Central Bank to stimulate and prop up European economies has been Long Term Refinancing Operations (LTRO). Initially these funds were loaned with the expectation of repayment in three years time. Now the first of these LTRO repayments is expected to commence soon. Some LTRO funds were used to purchase Spanish and Italian bonds, so an unwinding of those positions could affect borrowing capability in Spain and Italy. There is a possibility that banks moving to repay LTRO early could affect a sell-off of collateral, or a search for yields in other investments. This will be another of our issues to watch over the next few months, since it may signal a shift in investment strategies, or further deleveraging. The amount of LTRO loans is estimated to be near a Trillion Euros. About 2/3rds of the borrowing was from banks in Spain and Italy (video). The LTRO was successful in allowing for bank funding, and helped avoid a credit crunch. Gradual payback of LTRO will actually be a positive sign for the health of banking in Europe. While banks in Europe may be doing better, demand for automobiles has sunk to a 7 year low point. Some analysts think European auto sales may be near a bottom, and now provide an interesting investment alternative, though indications at the moment suggest a very slow recovery.
In the latest data release from the National Association of Home Builders (NAHB), sentiment amongst builders has increased slightly, to the highest levels since April 2006. The NAHB note that persistently tight mortgage credit conditions, and difficulties in obtaining appraisals continue to drag on builder confidence. The NAHB Housing Market Index only considers single family dwellings, and a reading over 50 would indicate good outlook. The latest NAHB Indexreading is 47 against 48 expected by analysts. Part of the reason for home price increases has been a 17% decline in available inventory in 2012. The Mortgage Bankers Association note that mortgage applications increased 15.2 percent for the week ending 11 January 2013. Refinance activity remains at 82% of total applications. December 2012 existing home sales declined to 4.94 million against 5.10 million expected. Investor activity in housing markets has also been strong, though much tougher to track in available information. In a recent note to investors, Blackstone Group reported that they were spending about $100 million a week on purchasing houses for use as rental properties, largely through foreclosure sales and short sales. Along with Colony Capital LLC and Two Harbors Investment Corporation, Blackstone Group are creating a new asset management investment class, in an area previously dominated by small investors. This is a market that analysts at JPMorgan predict could be worth as much as $1.5 Trillion in the near future. The only point of concern is that these large private equity companies might crowd out more traditional mom and pop investors, or that they may artificially affect price levels of some real estate. The good news in this is that while the housing market is still below historical levels, we have seen continued improvements over the last three years. Housing is no longer a drag on the US economy. Even new housing starts and filings of building permits increased in late 2012. These improvements should allow housing to contribute to GDP growth in the United States in 2013.
While US housing markets continue to improve, it now appears that property prices in some parts of China are reaching bubble levels and are now unstable. In China, either housing prices need to adjust and reset drastically, or wages need to increase substantially, though the latter possibility would usher in massive inflation pressures. Demand for housing in China, especially in Beijing, has fuelled investments as China continues on a path of urbanization. Investment in residential property in China now accounts for about 14.4 of overall GDP. This level is above the housing bubble level reached in the United States several years ago. It is not easy to obtain reliable data on Chinese housing markets, though this is one area we will continue to watch this year. Chinese authorities may like the boost to GDP now, though it is highly questionable that this is sustainable for much longer. While not entirely related to this issue, it is notable that the IMF has trimmed global GDP growth projections to just 3.5% in 2013 and 4.1% in 2014, with US growth at 2.0% in 2013. Europe is expected to contract 0.2% in 2013, with several countries expected to be in recession. One of the earliest attempts by the European Central Bank to stimulate and prop up European economies has been Long Term Refinancing Operations (LTRO). Initially these funds were loaned with the expectation of repayment in three years time. Now the first of these LTRO repayments is expected to commence soon. Some LTRO funds were used to purchase Spanish and Italian bonds, so an unwinding of those positions could affect borrowing capability in Spain and Italy. There is a possibility that banks moving to repay LTRO early could affect a sell-off of collateral, or a search for yields in other investments. This will be another of our issues to watch over the next few months, since it may signal a shift in investment strategies, or further deleveraging. The amount of LTRO loans is estimated to be near a Trillion Euros. About 2/3rds of the borrowing was from banks in Spain and Italy (video). The LTRO was successful in allowing for bank funding, and helped avoid a credit crunch. Gradual payback of LTRO will actually be a positive sign for the health of banking in Europe. While banks in Europe may be doing better, demand for automobiles has sunk to a 7 year low point. Some analysts think European auto sales may be near a bottom, and now provide an interesting investment alternative, though indications at the moment suggest a very slow recovery.
 In an unusual and somewhat unexpected move, the Deutsches Bundesbank (German Central Bank) announced that they would be moving physical gold to their own vaults in Germany. This move has prompted some speculation that there may be a shortage of physical reported gold in some storage locations, and worries that gold movements were being done to avoid a currency collapse. Some analysts think the move may be as simple as the Bundesbank not trusting other gold storagefacilities. The official Bundesbank announcement indicates that the reasoning is an increase in storage capacity in Germany, though they note that gold is often used to purchase other currencies. Oddly this move had almost no affect on gold futures markets, which continue to remain below $1700. Some of the pressure on gold futures may simply be due to further rotation into equities. In other commodities, there has been a growing downward pressure on iron ore prices, especially in light of somewhat slower global growth patterns. Recently it was revealed that one of the giants of mining, BHP Billiton (BHP), bought iron ore on the spot market in order to prop up prices. It's an unusual move from a company that produces iron ore, and BHP declined to comment on the move. A decline in iron ore prices would put pressure on mining companies, and be an indication of slower growth in China, who are currently the world's largest purchaser of iron ore. Amongst other mining companies, a research note from Nomura indicates that analysts expect some improvement in demand for diamonds, as prices stabilized in 2012. All these are signals that we may be near an interim top in many investment markets, though as long term investors these events might not have much of a lasting effect on our positions. Stock markets have been around a long time, and have experienced many changes and movements, which leads us to our last item of interest in this report, the discovery of the World's Oldest Share.
G. Moat
Disclosure: I hold positions in Euro futures and some European Sovereign Bonds through the Fisher-Gartman Risk Off ETN (OFF). This article is not a recommendation for investors to either buy, nor to sell, shares in OFF. Investors are advised to perform their own research prior to making investment decisions.
In an unusual and somewhat unexpected move, the Deutsches Bundesbank (German Central Bank) announced that they would be moving physical gold to their own vaults in Germany. This move has prompted some speculation that there may be a shortage of physical reported gold in some storage locations, and worries that gold movements were being done to avoid a currency collapse. Some analysts think the move may be as simple as the Bundesbank not trusting other gold storagefacilities. The official Bundesbank announcement indicates that the reasoning is an increase in storage capacity in Germany, though they note that gold is often used to purchase other currencies. Oddly this move had almost no affect on gold futures markets, which continue to remain below $1700. Some of the pressure on gold futures may simply be due to further rotation into equities. In other commodities, there has been a growing downward pressure on iron ore prices, especially in light of somewhat slower global growth patterns. Recently it was revealed that one of the giants of mining, BHP Billiton (BHP), bought iron ore on the spot market in order to prop up prices. It's an unusual move from a company that produces iron ore, and BHP declined to comment on the move. A decline in iron ore prices would put pressure on mining companies, and be an indication of slower growth in China, who are currently the world's largest purchaser of iron ore. Amongst other mining companies, a research note from Nomura indicates that analysts expect some improvement in demand for diamonds, as prices stabilized in 2012. All these are signals that we may be near an interim top in many investment markets, though as long term investors these events might not have much of a lasting effect on our positions. Stock markets have been around a long time, and have experienced many changes and movements, which leads us to our last item of interest in this report, the discovery of the World's Oldest Share.
G. Moat
Disclosure: I hold positions in Euro futures and some European Sovereign Bonds through the Fisher-Gartman Risk Off ETN (OFF). This article is not a recommendation for investors to either buy, nor to sell, shares in OFF. Investors are advised to perform their own research prior to making investment decisions.
As we end our first full week of market activity in 2013, most equities markets around the globe have rallied to near 52 week highs. Considering all the news and attention, it is just a little surprising that the S&P 500 only went up 0.38% for the week ending 11 January 2013. There are many ways to view this market rally, which like all rallies is unlikely to continue without some decline. It helps to look at bond market activity, some currency movement, and several indexes that monitor market activity, all of which give us correlation or confirmation of market direction. Trying to find the top of any rally, just like trying to find the bottom, is more luck than information gathering. The best we can hope to accomplish is buying near low points, and selling close to high points. When evaluating individual shares of companies, some tend to go up more than the overall market, while some fall much further during a correction. In general large cap companies tend to follow the market, while small and mid cap companies tend to overshoot and undershoot. The other common factors every January are fund positioning and the start of another round of quarterly earnings reports. Many hedge fund and mutual fund managers start off the new year buying shares of companies that make up the parts of mutual funds, Electronically Traded Funds (ETF), and hedge funds. This creates a supply and demand for shares of larger companies, with demand often driving share prices higher. Fitch Ratings noted that Money Market Funds recently increased their holdings in European Banks by 8% for the fifth straight month. On a calendar basis, Alcoa (AA) often starts off each quarterly round of earnings season. On 8 January Alcoa reported earnings of 0.06¢ per share (in-line with expectations) and revenues higher than expectations. Forward guidance was positive, including a long term outlook towards 2020. Despite initial positive reaction, within a couple days shares of Alcoa were back near where they started, and the results on the company had little sway on the markets. Earnings reports from several other companies , such as banking giant JPMorgan (JPM) near 16 January, are likely to have more of an effect on the direction of the overall market.
 There are several indicators that we can watch each day, or each week, that give us an idea of the state of stock markets. Often investors look at overbought and oversold indicators, which can be important to watch, but do not tell us all we need to know for the long term. On a daily basis we can watch the Arms Index to see if unusually heavy buying or selling is taking place. Where the Arms Index (TRIN) is more valuable than individual share overbought or oversold indicators, is that it factors in the upside and downside volumes of the entire New York Stock Exchange. When TRIN is less than 1.0, then buying activity to the upside is heavy, while when TRIN is higher than 1.0 selling activity is increasing. One additional use I have for the TRIN is when it spikes high, because that can be an indicator of panic selling, and sometimes that can be a good time to pick up shares of a company at a short term low point. However, if our investments tend to be longer term holdings, then we need a better long term trend indicator, which we see in the chart above called SPXA50R. This index is a measure of the percentage of stocks on the S&P 500 which are above their 50 day moving average (50dma). I have included the longer multi-year chart to show that SPXA50R rarely stays above the high 80s for long. That can be a great indicator for us to look at our holdings and see if we want to take some profits. Our example of how to use this for market bottoms is in August 2011 at 0.4000 and May 2012 at 13.80000. The event that caused a market sell-off in August 2011 was the first debt ceiling stand-off in Congress, and the downgrade to AA by S&P Ratings. Our late May 2012 bottom is a more recent example, but if you bought shares at some point then you are very likely to have seen a nice gain near early September, or you may have seen a nice gain early 2013. This is also a great indicator for people who do not have the time to check the markets often, since individual shares can continue to gain a little after a peak in SPXA50R. It also helps to watch Volatility in the markets and VIX is very useful indication of the perception of risk in the markets. Currently we have a very low Volatility Index (VIX) reading, which some consider a sign of complacency in the markets. Of these three indicators, using SPXA50R for making decisions on when to buy, sell, or rebalance your investments can be the most useful for long term investors.
 The biggest chatter in market news this past week has been about the Great Rotation into stocks. In times like this it can be tempting to think that you have missed the market, but it is better to be patient and not follow a hasty reaction. The inflows of funds into stocks are impressive when measured against the past couple years of January data, but compared to the massive outlfows in 2008 and 2009 the recent flow of funds is not significant. On a practical measure of various economic conditions, we still find slow growth in the United States, most of Europe in recession, emerging markets slowing, and even China resorting to stimulus spending on infrastructure. We really need several weeks of strong inflows before we can consider this a solid trend or rally. The roughly $22 billion that has flowed into equities since the beginning of January is the highest amount since September 2007, though emerging and world markets accounted for more of these moves than did US stock markets. Despite the rotation out of safe haven bond investments and into equities, several analysts are warning of a correction in the near future. Ahead of Fiscal Cliff negotiations, and worries about changes to the tax codes in the US, some investors booked profits in December; some of those investors may now be trying to get back into the market. Recent economic data has been somewhat ignored by investors, especially the not so great figures on the US Trade Deficit, hitting $48.7 billion in November 2012 against an expectation of $41.3 billion. Exports and Imports did increase in November, which is slightly positive for the US and Global markets. Automotive Sales increased sharply in November. Manufacturing data in the US, researched through the Philadelphia Federal Reserve, saw more downward revisions for 2012 than upwards. The US Budget Deficit fell to a very low $260 million in December 2012, which is the lowest since December 2007. Jobless Claims came in at 371000 against an expectation of 36500, with the prior figures revised downwards to 367000. Market Analyst Tom DeMark, advisor to SAC Capital, Soros Funds, Omega Advisors, and others, expects a high in the S&P 500 near 1500, to be followed by a fall of at least 5.5% in the near future. Quite simply he expects buyers to run out as we near the psychological barrier of 1500 on the S&P Index.
 In commodities we find that Iron Ore prices has climbed recently, mostly in speculation of a new ruling group in China ushering in new infrastructure spending in the near future. Given this spike in Iron Ore, some analysts do not see these price levels as sustainable. We can see some of the affects of this in the recent rise in the Australian Dollar (AUD) relative to other currencies. Often commodity currencies are considered as risk currencies, since they are tied to global growth and construction spending. So we get some correlation of stock market gains when we see the Australian Dollar increasing relative to the US Dollar (AUD/USD). If we see a continued decline in the AUD/USD pair, then we usually find a decrease in stock markets, though sometimes the currency decline happens prior to a market decline. Brazil is another large exporter of Iron Ore, mostly through global mining giant Vale (VALE). While the Brazilian Real is not heavily traded on Forex (Foreign Exchange) markets, we can watch the share price action in Vale for another indicator on changes in sentiment towards raw materials investments.
Perhaps the largest recent change, which I mentioned a few times in prior articles, is a relaxing of Basel III rules ahead of the 2018 compliance deadline. The Basel Committee on Banking Supervision recently published a revised set of rules for bank liquidity. Global banks will need to meet 60% of the rules by 2015, and follow full implementation in 2019, instead of 2018. Banks in the UK and Switzerland are thought to be slightly ahead or in line with Basel III rulesimplementation, with US banks not far behind, though European banks are not faring as well. The major change in the newest rules is that some equities can be used for collateral, including AA or greater Mortgage Backed Securities (MBS). One of the largest expansions in the new rules is the allowance of lower rated bonds as collateral, though obviously a haircut (valuation reduction) is applied. Large banks with cash positions may find some bonds more attractive for yield, especially with the European Central Bank and the Federal Reserve buying sovereign bonds on the open secondary markets. Where we can see the effects of this is through watching the 10 year US Treasury and the 30 year US Treasury. The 10 year note is the most issued, though the 30 year is a good correlation for moves on the 10 year Treasury. Under normal (historical) markets, we often find a rotation out of bonds and into stocks, which should drive yields in bonds higher. Yield moves inverse to bond prices on the secondary market. While the yield on the 10 year and 30 year notes has climbed recently, both are still at relatively low yield levels. A recent auction of new 30 year US Treasuries saw solid demand, indicating that the demand for safe haven bonds is still somewhat high. As long as we see continued strong demand for Treasuries, it is tough to consider the recent stock markets rally as a strong and continuing trend.
In commodities we find that Iron Ore prices has climbed recently, mostly in speculation of a new ruling group in China ushering in new infrastructure spending in the near future. Given this spike in Iron Ore, some analysts do not see these price levels as sustainable. We can see some of the affects of this in the recent rise in the Australian Dollar (AUD) relative to other currencies. Often commodity currencies are considered as risk currencies, since they are tied to global growth and construction spending. So we get some correlation of stock market gains when we see the Australian Dollar increasing relative to the US Dollar (AUD/USD). If we see a continued decline in the AUD/USD pair, then we usually find a decrease in stock markets, though sometimes the currency decline happens prior to a market decline. Brazil is another large exporter of Iron Ore, mostly through global mining giant Vale (VALE). While the Brazilian Real is not heavily traded on Forex (Foreign Exchange) markets, we can watch the share price action in Vale for another indicator on changes in sentiment towards raw materials investments.
Perhaps the largest recent change, which I mentioned a few times in prior articles, is a relaxing of Basel III rules ahead of the 2018 compliance deadline. The Basel Committee on Banking Supervision recently published a revised set of rules for bank liquidity. Global banks will need to meet 60% of the rules by 2015, and follow full implementation in 2019, instead of 2018. Banks in the UK and Switzerland are thought to be slightly ahead or in line with Basel III rulesimplementation, with US banks not far behind, though European banks are not faring as well. The major change in the newest rules is that some equities can be used for collateral, including AA or greater Mortgage Backed Securities (MBS). One of the largest expansions in the new rules is the allowance of lower rated bonds as collateral, though obviously a haircut (valuation reduction) is applied. Large banks with cash positions may find some bonds more attractive for yield, especially with the European Central Bank and the Federal Reserve buying sovereign bonds on the open secondary markets. Where we can see the effects of this is through watching the 10 year US Treasury and the 30 year US Treasury. The 10 year note is the most issued, though the 30 year is a good correlation for moves on the 10 year Treasury. Under normal (historical) markets, we often find a rotation out of bonds and into stocks, which should drive yields in bonds higher. Yield moves inverse to bond prices on the secondary market. While the yield on the 10 year and 30 year notes has climbed recently, both are still at relatively low yield levels. A recent auction of new 30 year US Treasuries saw solid demand, indicating that the demand for safe haven bonds is still somewhat high. As long as we see continued strong demand for Treasuries, it is tough to consider the recent stock markets rally as a strong and continuing trend.
 In bizarre market news, we find mention of a Trillion Dollar Platinum coin being mentioned as a way around upcoming Debt Ceiling negotiations. While in theory it would work to avoid the Debt Ceiling, and oddly enough would be completely legal, such an act might spook global investors, who may question the credit worthiness of the United States. We are likely to see a battle on the Debt Ceiling, and we may get a repeat of the sell-off that happened in August 2011 during similar negotiations. Ultimately I think we can expect politicians to avoid playing with the credit worthiness of the United States, though we can reasonably expect them take discussions right up to the deadline. if this talk of Trillion Dollar platinum coins is not odd enough, you might find some odd amusement in this article about gold valuations in the mythical land of Hobbits, Elves, Orcs, and Men called theMacroeconomics of Middle Earth. Here on the real earth we find that North Korea has been seeking advice from Germany on attracting international investors. While this would be a positive development for global markets, it seems investors are still taking a wait and see approach to this news. Across the globe we find rumours of Hugo Chavez of Venezuela possibly dead or in a coma, yet demand for Venezuelan Debt has recently soared. The market does not seem to be pricing in a demise of Hugo Chavez, possibly because China continues to invest in Venezuela.
In housing news, we find recent talks of a settlement over mortgage irregularities with ten US banks. The final settlement amount is $8.5 billion, with $3.3 billion expected to go to former homeowners, and $5.2 billion slated for mortgage modifications. Fitch Ratings expect stable demand for Mortgage Backed Securities (MBS) to continue throughout 2013, which is positive for continued improvements in the US housing markets. Fitch also note a change in servicing of commercial mortgages (CMBS) following downgrades, which is another trend they expect to continue. On another positive note for Commercial Mortgage Backed Securities (CMBS), Fitch Rating note a decline in delinquencies to under 8% at the close of 2012. So while we might not be entirely sure where and when stock and bond markets may go, we can reasonably expect continued investments in housing to push along a recovery in the housing sector. Patience and carefully watching market indicators can reward long term investors. Here is wishing all of you a happy and prosperous 2013.
G. Moat
Disclosure: I hold a long positions in Alcoa (AA) and Vale (VALE). This article is not a recommendation for investors to either buy, nor to sell, shares in Alcoa nor Vale. Investors are advised to perform their own research prior to making investment decisions.
In bizarre market news, we find mention of a Trillion Dollar Platinum coin being mentioned as a way around upcoming Debt Ceiling negotiations. While in theory it would work to avoid the Debt Ceiling, and oddly enough would be completely legal, such an act might spook global investors, who may question the credit worthiness of the United States. We are likely to see a battle on the Debt Ceiling, and we may get a repeat of the sell-off that happened in August 2011 during similar negotiations. Ultimately I think we can expect politicians to avoid playing with the credit worthiness of the United States, though we can reasonably expect them take discussions right up to the deadline. if this talk of Trillion Dollar platinum coins is not odd enough, you might find some odd amusement in this article about gold valuations in the mythical land of Hobbits, Elves, Orcs, and Men called theMacroeconomics of Middle Earth. Here on the real earth we find that North Korea has been seeking advice from Germany on attracting international investors. While this would be a positive development for global markets, it seems investors are still taking a wait and see approach to this news. Across the globe we find rumours of Hugo Chavez of Venezuela possibly dead or in a coma, yet demand for Venezuelan Debt has recently soared. The market does not seem to be pricing in a demise of Hugo Chavez, possibly because China continues to invest in Venezuela.
In housing news, we find recent talks of a settlement over mortgage irregularities with ten US banks. The final settlement amount is $8.5 billion, with $3.3 billion expected to go to former homeowners, and $5.2 billion slated for mortgage modifications. Fitch Ratings expect stable demand for Mortgage Backed Securities (MBS) to continue throughout 2013, which is positive for continued improvements in the US housing markets. Fitch also note a change in servicing of commercial mortgages (CMBS) following downgrades, which is another trend they expect to continue. On another positive note for Commercial Mortgage Backed Securities (CMBS), Fitch Rating note a decline in delinquencies to under 8% at the close of 2012. So while we might not be entirely sure where and when stock and bond markets may go, we can reasonably expect continued investments in housing to push along a recovery in the housing sector. Patience and carefully watching market indicators can reward long term investors. Here is wishing all of you a happy and prosperous 2013.
G. Moat
Disclosure: I hold a long positions in Alcoa (AA) and Vale (VALE). This article is not a recommendation for investors to either buy, nor to sell, shares in Alcoa nor Vale. Investors are advised to perform their own research prior to making investment decisions.
Welcome to the start of a new year. Hopefully all of you had an enjoyable New Years, and are starting off 2013 with a fresh outlook. The same might not be said for politicians in Washington, D.C. who staged a very late night vote to make deals to avoid the Fiscal Cliff. Most stock markets around the globe reacted positively on news that a deal passed the Senate and House of Representatives, though considering the build-up to the vote, the gains in markets appear to be more of a relief rally. The Legislative Branch is empowered to pass spending bills prior to the start of each fiscal year, yet since 1996 it has repeatedly failed to accomplish that task. The previous temporary measures were agreed to in August of 2011, at a time when a failure to negotiate led to sharp market declines. When the first measures passed the Senate early on New Year's Day, the Congressional Budget Office estimated that the deal would add $4 trillion to US debt. The House of Representatives voted on the measures prior to the opening of US stock markets, though the measures that passed should be of continuing concern. President Obama signed the bill into law on 3 January 2013. Of some benefit is extension of Bush era tax cuts, though over the next decade taxes will increase on Americans earning over $400K per year. Capital gains taxes, and taxes on dividends, return to the old rate of 20% instead of the more recent 15%. The deal means taxes increasing for 77% of Americans. What we will need to watch is that previously agreed automatic spending cuts are only extended for two months, which sets the stage for more tough negotiations in March 2013. The deal made on the Fiscal Cliff does nothing to address long term tax reform, nor long term entitlements. Even the IMF suggest that the United States could do more to address long term debt levels. We are likely to see more battles as the debt ceiling approaches, since the US Treasury have indicated that they can only avoid hitting the debt ceiling for about two months. When measured under normal circumstances, the United States already hit the debt ceiling on 31 December 2012. After that the only options beyond defaulting on US Treasuries would be withholding payments to Federal workers, soldiers, or recipients of Social Security. Uncertainty over the outcome held back financial markets in late 2012, so it should not be surprising that we are seeing solid buying volume on stock markets, but this is unlikely to last. On Thursday 3 January 2013 Representative Boehner was reconfirmed as Speaker of the House in a narrow vote, which sets up the next battle over the debt ceiling and further spending cuts.
 The latest private sector payrolls report from ADP and Moody's Analytics indicated 215000 jobs were added by private employers, up from 148k in November, and much higher than an expected gain of 133k. There is some criticism of the latest ADP figures that occurs each December, usually blamed upon an accounting quirk, so we might actually see these figures restated next month. The November APD Jobs Report was revised from 118k to 143000. The Department of Labor released unemployment claims data that was estimated due to a lack of information from nine states, including California and Virginia. Initial unemployment claims appear to have increased to 372000 (seasonally adjusted). While I expect some restatement of figures, the trend through 2012 was a slight improvement in employment. Some analysts at Goldman Sachs (GS) and Credit Suisse (CS) are expecting continued employment improvements in early 2013. CME Group project unemployment in the US will decline below 7% by the end of 2013. We can see some of the affects of this trend through increased retail sales. However, the holiday shopping season retails sales indications indicate some retailers doing far better than others. We still do not have figures from retail giants Walmart (WMT) and Best Buy (BBY), though discount stores appear to have seen increased retail sales. The impacts of Hurricane Sandy, headlines about the Fiscal Cliff, and sombre mood following the Connecticut school shooting were thought to have held back holiday spending. Mastercard affiliated research firm SpendingPulse indicated retail sales that they track grew 2% more than in the 2011 holiday shopping season. This holiday shopping season could prove to be the weakest for retailers since 2008.When we consider the long drought conditions across much of the United States in 2012, we expect higher food prices will limit retail sales in early 2013. Guns sales and applications for gun permits increased to historically high levels through 2012. Auto sales slightly increased in December for some domestic auto companies, though not enough to offset large gains through 2012 for Japanese rivals. The biggest gains were posted by Volkswagen Group in 2012 with a 31% increase in sales. Upcoming debt ceiling negotiations may cause some slowing of auto sales in the first quarter of 2013, mostly over uncertainty about the direction of the economy in the United States.
 Ratings agency S&P commented that they did not feel the Fiscal Cliff deal changed the outlook on the United States for 2013, though they did state that the risk of a recession had been reduced. S&P Ratings project 2013 US GDP growth at 2.2%. Moody's Rating is taking a wait-and-seeapproach to the United States, based upon the expectation of more fiscal negotiations. Moody's has indicated that more actions may be needed to maintain a AAA rating. So far Fitch Ratings have yet to comment about the outlook for the United States, but we have found several other market analysts and gurus weighing in with predictions for 2013 market conditions. Steen Jakobsen, Chief Economist of Saxo Bank, identifies some potentially negative market moving events of which we should be watchful. He points out that the debt burdens and fiscal deficits now in place are the highest since World War II, largely on the back of continual extend-and-pretend policies. He rightly points out that many investors now watch changes in central bank policies and liquidity operations in order to judge market direction. It is like markets are addicted to stimulus, and real levels are unreachable without central bank intervention. In some ways we can expect that the bottom of the markets in 2009 will not be seen again, all due to central bank activity to avoid a repeat of that huge sell-off. If you follow that link from Saxo Bank, there is a PDF with 10 predictions for 2013. Of that list, one of the more interesting items is 30 year US Treasury yields, which Saxo Bank expect to see increase. Currently global bond markets hold three times the invested funds of stock markets, mostly with little to no yield. Despite announcements that the Federal Reserve and the European Central Bank will continue buying sovereign debt to keep interest rates low, there is no guarantee that investors will stick with bonds. Total bond issuance in 2013 is expected to decline in most countries. This may temper demand somewhat, though issuance is expected to increase from the United States, Canada, Russia, India, and China. If we see a correction in bond yields, then it may signal a good time for investors to move some funds back into bonds. Some corporate bonds proved to be better investments in fixed income in 2012 than highly rated sovereign bonds. In a diversified portfolio, it is almost always a good idea to have a portion of investments in fixed income funds. M&G Investments highlights some of the bright spots in fixed income in 2012. While M&G Investments do not expect fixed income markets to perform as well in 2013, they do point out that taking some risk is a necessary part of generating investment gains. Byron Wein of private equity giant Blackstone Partners recently released his ten predictions for 2013. Of note are the S&P falling to near 1300, financial company stocks struggling, further drought impacting food prices, and gold reaching $1900 per ounce on continued Central Bank stimulus and currency debasement.
 Argus Market Research points out that economies in Europe appear to have stabilized, as purchasing managers indexes showed slight improvements in December 2012. On a global basis, the International Monetary Fund (IMF) is expecting 3.6% growth in 2013, led by China and India. Many countries in Europe are expecting to be in recession throughout 2013. In France, one of the largest economies in Europe, the number of unemployed reached 3.132 million people, the highest level since 1998. Tough austerity measures are also beginning to have a negative real affect in Portugal, who are now asking the IMF and European Union to give some form of relief on continued demands. Investors may want to watch European markets, and shares of European companies with listings in the United States, to see if some buying opportunities appear. It is important to keep in mind that while Europe may be at a bottom, there is a long way to go until meaningful economic recovery and growth return. Despite the high growth rate projections for China, Argus Research point out that South Africa still has a higher GDP per capita and Brazil is even higher in GDP per capita. Investors may find several opportunities in companies headquartered in South Africa and Brazil, though the political climate aspect of risk is different than that found with US and European companies. South America may prove to be a good investment choice in 2013, as indicated by the recent upgrade by S&P Ratings for Chile from AA- to AA+. We can also expect to read more about problems in Greece, as highlighted in a report released on Christmas Eve. The report highlights the difficulties of Greece in collecting an estimated €53 billion (Euros) of outstanding taxes. In that report, the European Union and the IMF suggest that only about 20% of that amount might be collectable, and that Greece needs more people to investigate the largest debtors in Greece. We might reasonably expect more write-downs of Greek debt, new bailouts, or further missed targets in 2013. Despite numerous predictions of a Euro collapse, or an exit of Greece from the Eurozone (called a Grexit), 2012 proved that Europe can bounce back, though the road to full economic recovery will be slow. However, problems do remain to be solved in Greece, perhaps best highlighted by the discovery that the former Prime Minister Papaconstantinou was directly connected to four names removed from a list of possible tax evaders provided by the IMF to the Greek Minister of Justice. Given the revelations of corruption in Greece, it should not be too surprising that someone in the Greek government altered the IMF list (also called the Lagarde List) to remove names of politicians and their family members who have large Swiss bank accounts outside of Greece.
Overseas investments always present different risks, as highlighted by an unusual incident in China where Citic Trust Company delayed an interest payment to investors due to one of it's debtors missing a major payment. Researchers at the Federal Reserve note that the rebound in China's economy is uneven, and that demand for loans in China have decreased, which puts into question the IMF's projection of 8% growth in 2013. Also of note in that report, due out in full this month, is that inventories of raw materials have risen to very high levels. We may see a sharp decline in commodity prices in early 2013, considering that China is a very large purchaser of raw materials from around the world. Official Chinese government figures on the state of their economy are always open to scepticism, though global bank HSBC have a fairly reliable research team looking into the Chinese economy. The December HSBC survey of purchasing managers index, in China, indicates an improvement in economic conditions, with a 51.5 PMI reading being the highest since early 2011. There is a great set of data available at this link for the latest HSBC figures on China's economy, and it is notable that growth has stagnated for most of 2012. It remains to be seen if new leadership in China can usher in a new era of renewed growth. Global mining giants BHP Billiton (BHP), Rio Tinto (RIO) and Vale (VALE) may experience reduced revenues due to price declines on iron ore and other raw materials due to slowing demand. Investment bank Barclays Capital encourage buying gold on dipsthroughout 2013, and they project a decline in the Japanese Yen (JPY). Upcoming Basel III bank regulations, with 2013 target capital ratios ahead of 2018 compliance, may affect gold markets through the year. The Japanese Yen has been falling against the Dollar (USD) and Euro (EUR) recently, partially on the promise by newly elected Prime Minister Shinzo Abe to push the Bank of Japan to directly purchase Japanese government bonds in order to stimulate the economy. Such a policy shift is active currency devaluation. When combined with gains in the Euro and an improved US economy, it is not surprising to see the recent moves in the Yen.
Argus Market Research points out that economies in Europe appear to have stabilized, as purchasing managers indexes showed slight improvements in December 2012. On a global basis, the International Monetary Fund (IMF) is expecting 3.6% growth in 2013, led by China and India. Many countries in Europe are expecting to be in recession throughout 2013. In France, one of the largest economies in Europe, the number of unemployed reached 3.132 million people, the highest level since 1998. Tough austerity measures are also beginning to have a negative real affect in Portugal, who are now asking the IMF and European Union to give some form of relief on continued demands. Investors may want to watch European markets, and shares of European companies with listings in the United States, to see if some buying opportunities appear. It is important to keep in mind that while Europe may be at a bottom, there is a long way to go until meaningful economic recovery and growth return. Despite the high growth rate projections for China, Argus Research point out that South Africa still has a higher GDP per capita and Brazil is even higher in GDP per capita. Investors may find several opportunities in companies headquartered in South Africa and Brazil, though the political climate aspect of risk is different than that found with US and European companies. South America may prove to be a good investment choice in 2013, as indicated by the recent upgrade by S&P Ratings for Chile from AA- to AA+. We can also expect to read more about problems in Greece, as highlighted in a report released on Christmas Eve. The report highlights the difficulties of Greece in collecting an estimated €53 billion (Euros) of outstanding taxes. In that report, the European Union and the IMF suggest that only about 20% of that amount might be collectable, and that Greece needs more people to investigate the largest debtors in Greece. We might reasonably expect more write-downs of Greek debt, new bailouts, or further missed targets in 2013. Despite numerous predictions of a Euro collapse, or an exit of Greece from the Eurozone (called a Grexit), 2012 proved that Europe can bounce back, though the road to full economic recovery will be slow. However, problems do remain to be solved in Greece, perhaps best highlighted by the discovery that the former Prime Minister Papaconstantinou was directly connected to four names removed from a list of possible tax evaders provided by the IMF to the Greek Minister of Justice. Given the revelations of corruption in Greece, it should not be too surprising that someone in the Greek government altered the IMF list (also called the Lagarde List) to remove names of politicians and their family members who have large Swiss bank accounts outside of Greece.
Overseas investments always present different risks, as highlighted by an unusual incident in China where Citic Trust Company delayed an interest payment to investors due to one of it's debtors missing a major payment. Researchers at the Federal Reserve note that the rebound in China's economy is uneven, and that demand for loans in China have decreased, which puts into question the IMF's projection of 8% growth in 2013. Also of note in that report, due out in full this month, is that inventories of raw materials have risen to very high levels. We may see a sharp decline in commodity prices in early 2013, considering that China is a very large purchaser of raw materials from around the world. Official Chinese government figures on the state of their economy are always open to scepticism, though global bank HSBC have a fairly reliable research team looking into the Chinese economy. The December HSBC survey of purchasing managers index, in China, indicates an improvement in economic conditions, with a 51.5 PMI reading being the highest since early 2011. There is a great set of data available at this link for the latest HSBC figures on China's economy, and it is notable that growth has stagnated for most of 2012. It remains to be seen if new leadership in China can usher in a new era of renewed growth. Global mining giants BHP Billiton (BHP), Rio Tinto (RIO) and Vale (VALE) may experience reduced revenues due to price declines on iron ore and other raw materials due to slowing demand. Investment bank Barclays Capital encourage buying gold on dipsthroughout 2013, and they project a decline in the Japanese Yen (JPY). Upcoming Basel III bank regulations, with 2013 target capital ratios ahead of 2018 compliance, may affect gold markets through the year. The Japanese Yen has been falling against the Dollar (USD) and Euro (EUR) recently, partially on the promise by newly elected Prime Minister Shinzo Abe to push the Bank of Japan to directly purchase Japanese government bonds in order to stimulate the economy. Such a policy shift is active currency devaluation. When combined with gains in the Euro and an improved US economy, it is not surprising to see the recent moves in the Yen.
 In our watch of global macro events that could affect economic conditions, our first surprise of 2013 comes from a rare speech by North Korean leader Kim Jong-un. In that speech he called for an end to the conflict with South Korea, possibly in an appeal for further aid and assistance. It's too early to tell how genuine the intentions were in that speech, though obviously an end to conflict with North Korea could boost economies in northeast Asia, especially the economy of South Korea. The other possible reason behind the move by North Korea may be the success of continued tough economic sanctions against Iran. As Europe and the United States moved to isolate Iran economically, Iran damaged their internal affairs by attempting to enact currency control and a new currency exchange. Some analysts feel it is only a matter of time for Iran's nuclear ambitions to be successful, but it is not clear that the people of Iran will continue supporting the current ruling group. The continued decline of Syria, and changes in North Africa due to Arab Spring events, may prompt more changes in the Middle East and Near East. During research and compilation of this article, some news is arriving that Venezuelan President Hugo Chavez may be in his last days, or perhaps is already dead. If Chavez fails to appear for 10 January 2013 inauguration, Venezuela would stage another round of new elections. Hugo Chavez has been fighting an unspecified form of cancer, and has been seeking treatment in Cuba throughout much of the last year. Venezuela is one of the largest oil producing countries in the world, though production has declined as Chavez moved to nationalize much of the oil industry, ceasing assets from private companies. Obviously expanded conflict zones or collapses of ruling parties could affect the price of oil, international shipping, or increase military expenses in Western nations going through economic recovery. Hopefully the current conflicts find some resolution this year, and we see a decline in conflicts, rather than an escalation. Most of these would be potential Black Swan events, and they would rarely create a lasting negative economic impact.
 This is a slow time of year for housing news, though the New York Times reports that a possible settlement may be near between 14 large banks and the government over housing loan abuses. The amount suggested is near $10 billion, with about $3.75 billion going to compensate people who have already lost their homes, and an additional $1.5 billion in unspecified relief. Negotiations continue through the Office of the Comptroller of the Currency and the 14 banks, though a settlement would relieve banks of the task of reviewing many loans already at some phase of the foreclosure process. Housing has been one of the few bright spots in the US economy in 2012, so this would help continue that progress. Housing research firm CoreLogic released the latest figures on the Shadow Inventory of properties as of October 2012. In that report, CoreLogic notes Shadow Inventory declined by 12% to an estimated 2.3 million units, or about seven months of supply. The Federal Reserve will be continuing the program to purchase Mortgage Backed Securities (MBS) on the open market, though it appears they are somewhat frustrated with mortgage rates that remain higher than they expected. The Federal Reserve challenges the notion of increased costs, and suggest that a 2.6% thirty year fixed mortgage should be possible under current market conditions. While the Federal Reserve do not expect mortgage rates to drop under 3%, they do think mortgage rates could fall a bit further this year. The Dallas Federal Reserve released new studies on Service Sector Activity in Texas, indicating longer working week and stronger labor demand growth. That Dallas Fed note some optimism amongst businesses in Texas, which bodes well for the region in early 2013. In a strange twist on the ongoing economic crisis we have faced since 2008, bailed out insurance company AIG (AIG) is rolling out a two week long ad campaign basically thanking the government for saving the company. AIG received about $182 billion in bailout funding as the government took over the failed insurer, though the US Treasury managed to sell all holdings in AIG with a profit of $22.7 billion in 2012. The Federal Open Markets Committee (FOMC) released mid December 2012meeting minutes, indicating a desire to discontinue some stimulus measures by the end of 2013. So with some positive developments, and our overview of events to watch for in 2013, we wish you a prosperous year of investing.
G. Moat
Dislosure: I hold a long positions in Credit Suisse (CS) and Vale (VALE). This article is not a recommendation for investors to either buy, nor to sell, shares in Credit Suisse nor Vale. Investors are advised to perform their own research prior to making investment decisions.
This is a slow time of year for housing news, though the New York Times reports that a possible settlement may be near between 14 large banks and the government over housing loan abuses. The amount suggested is near $10 billion, with about $3.75 billion going to compensate people who have already lost their homes, and an additional $1.5 billion in unspecified relief. Negotiations continue through the Office of the Comptroller of the Currency and the 14 banks, though a settlement would relieve banks of the task of reviewing many loans already at some phase of the foreclosure process. Housing has been one of the few bright spots in the US economy in 2012, so this would help continue that progress. Housing research firm CoreLogic released the latest figures on the Shadow Inventory of properties as of October 2012. In that report, CoreLogic notes Shadow Inventory declined by 12% to an estimated 2.3 million units, or about seven months of supply. The Federal Reserve will be continuing the program to purchase Mortgage Backed Securities (MBS) on the open market, though it appears they are somewhat frustrated with mortgage rates that remain higher than they expected. The Federal Reserve challenges the notion of increased costs, and suggest that a 2.6% thirty year fixed mortgage should be possible under current market conditions. While the Federal Reserve do not expect mortgage rates to drop under 3%, they do think mortgage rates could fall a bit further this year. The Dallas Federal Reserve released new studies on Service Sector Activity in Texas, indicating longer working week and stronger labor demand growth. That Dallas Fed note some optimism amongst businesses in Texas, which bodes well for the region in early 2013. In a strange twist on the ongoing economic crisis we have faced since 2008, bailed out insurance company AIG (AIG) is rolling out a two week long ad campaign basically thanking the government for saving the company. AIG received about $182 billion in bailout funding as the government took over the failed insurer, though the US Treasury managed to sell all holdings in AIG with a profit of $22.7 billion in 2012. The Federal Open Markets Committee (FOMC) released mid December 2012meeting minutes, indicating a desire to discontinue some stimulus measures by the end of 2013. So with some positive developments, and our overview of events to watch for in 2013, we wish you a prosperous year of investing.
G. Moat
Dislosure: I hold a long positions in Credit Suisse (CS) and Vale (VALE). This article is not a recommendation for investors to either buy, nor to sell, shares in Credit Suisse nor Vale. Investors are advised to perform their own research prior to making investment decisions.
