
Time to Take Profits
The early August rally has gained some legs, though without any volume confirmation. As the old saying goes, markets can remain irrational far longer than investors can stay solvent. It is always difficult to find a top or bottom in any market, though we hope to buy near lows, and sell near highs. So the question we may be facing now is how much higher can markets rally. What is really interesting is that this rally is not widespread, with much of the volume going towards large caps very selectively.
 Usually we can find some confirmation of a rally by looking at several other factors. Volume is only one issue, and by itself is not enough of a reliable indication that we should take notice, nor worry about a continued rally. We have been through a month with draught, heat waves, and the 2012 Olympics, and also a time of year when historically volumes are a bit low. However, to give this some perspective, average daily trading volume on the NYSE reached a multi-year low last seen in 2007. When we look at market conditions for 2007 at that low volume point, we find that stock markets were very close to a high point. The economic conditions were still favorable in 2007. Bear Stearnes had yet to show any signs of troubles in 2007, and Lehman Brother’s and AIG appeared to be financially healthy. Even the housing bubble was just beginning to show signs of trouble in 2007. So here we are five years later without much indication that the economy is better than in 2007, nor even that the economy near levels seen five years ago. The spark of the current rally appears to have been European Central Bank (ECB) chief Mario Draghi, though in essence all he stated was that the ECB was willing to do whatever is necessary to stabilize the Euro. Indeed, the debt levels of Spain and Italy are still high, and their respective bond yields have not changed much. Goldman Sachs Global Research recently noted that Mario Draghi’s speech did make a difference in lowering Spanish and Italian bond yields, yet those yields are still historically much higher than usual, measured against German bond yields. Nomura noticed a similar trend in bonds, yet point to a historical basis of convertability, based upon old currencies before the Euro. The implied suggestion is that bond purposes on secondary markets for Spanish and Italian debt are pointing towards a break-up of the Euro. I don’t personally think that will happen, and it should be noted that most of this secondary bond activity has been generated via hedge funds.
The next area we would look for confirmation of a rally would be in the market for U.S. Treasuries. A look at the 10 Year U.S. Treasury shows a bottom yield of 1.38% in late July, then a nearly straight climb up to 1.82% on 17 August 2012. On a six month basis, the yield is still low, though that may be more a factor of Operation Twist, as mentioned in previous articles. If we look at the 3 Year U.S. Treasury yield, we find a similar pattern, suggesting demand for safe haven investments has slowed slightly. A look at the 30 Year U.S. Treasury yield, which is not part of Operation Twist, confirms this trend. The new 10 Year note issuance on 8 August 2012 and weak action on new 30 Year notes issued 9 August 2012, suggest some movement out of safe haven assets. Usually we would see movements out of bonds, and into equities, in normal markets. So the weak bond auctions suggest that volume should have increased on stock markets, though it did not. That leads us to research why that did not happen as expected.
In mid July this year, The Financial Times noted an interesting comment from Federal Reserve Chairman Ben Bernanke, regarding the possibility of further “non-standard programs”. Economist Tim Dey noted that continuing Federal Reserve purchases of U.S. Treasuries, might eventually cause a deterioration of the functioning of bond markets. Since bond markets do seem to be hitting a lull in volume, this may be the early stages of problems. The trouble is that Operation Twist is slated to last through the end of 2012. The other interesting thing pointed out in the FT Alphaville article is how QE3 might be implemented, if the Federal Reserve makes such a move. One possibility is through purchases of Mortgage Backed Securities (MBS). This was part of QE1 and the Federal Reserve did manage to sell some MBS holdings purchased in 2010 at the beginning of this year. The implied impact on the housing market would be a further reduction in mortgage rates, or enabling an expansion of mortgage origination.
 Keeping that in mind, the next thing we will look at is the current market inResidentialand Commercial Mortgage Backed Securities (RMBS and CMBS). Fitch Ratings has several reports and notes of interest that have been released recently. The first note of interest deals with Reverse Repo (or re-purchase) agreements, which are financial agreements that function like loans, though usually only used between banks. The greatest change noted by Fitch was the use of low quality sub-prime and Alt-A RMBS as collateral had greatly increased. The largest users of that collateral in these counter-party agreements has been large global banks who recently had purchased deeply discounted MBSs from the Federal Reserve, which had been part of QE1. The implication is that existing prior MBS were effectively removed from the market by use as collateral. This suggests that demand for MBS should increase, which would be expected to drive the market for mortgage origination and new MBS issuance. The other possibility is a shortage of collateral pushing large banks to use these lower quality MBS more often. The next Fitch Ratings report of note deals with default rates in CMBS, notable in that despite increased levels of real estate lending, loans continue to default at maturity. Fitch cover $24 Billion of the CMBS market, and expect around 41% of loans would become ineligible for refinancing. However, late payments declined in June on RMBS to around 8.48% overall, though the rate on multi-family property types only declined to 10.89%, while increasing to 11.46% in hotel properties. The Fitch delinquency index covers $33.2 Billion in existing loans. Fitch Ratings did not in a recent survey of investment managers that there was a greater expectation of homeprice increases over the next 18 months, which might provide some lift to the economy.
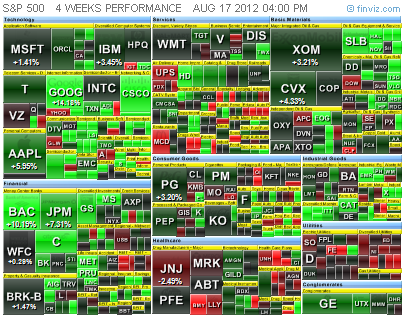 So far what we are finding in our research is that money is essentially tied up. That may go some ways to explaining the low volume on stock markets, but we need to look at other areas to get a better big picture view. Outside of bank counterparty agreements, we find that lending is still constrained, maybe not as badly as the start of the credit crunch, but there has been little improvement. Mario Draghi of the European Central Bank recently stated “… if we want to get out of this crisis, we have to repair this financial fragmentation.” European banks are in a tighter crunch than U.S. based banks, as their individual national level central banks have pushed them to constrain operations predominantly within their borders. Partially this is a sovereign debt issue, and a way to get certain banks to hold more sovereign debt, the idea being that easy to sell collateral provides “safer” asset holdings. When we look at the strong push to meet Basel III requirements, instead of a credit crunch we are now moving to a capital crunch (Basel III requirements included greater capital holdings). This would be less of an issue, if it was only central banks pushing on large financial institutions to operate more “safely” and minimize risk.
That led towards more research on the shadow banking sector, with a look at derivatives and other financial instruments. Under current accounting rules, certain financial instruments, like derivatives or CDS, can be used to hedge. This works somewhat like insurance, though over the last decade there has been a distortion of this market, and often CDS trade simply on supply and demand in an attempt to generate profit. The problem in accounting rule changes is that using CDS for hedging allows a bank to become more highly leveraged. Once this trend started over the last few years, despite some changes in regulations, the market for CDS and derivatives increased. Since it is often peer-to-peer trading and contracts, tracking activity becomes very difficult. There is little to no transparency in the shadow banking world, which is why it is called that. Shadow banking has nothing to do with conspiracy theories, it is quite simply banking activity with little to no reporting standards, so those outside the banking community are barely able to follow movements. When JPMorgan posted losses recently due to such activity, even financial markets traders had difficulty figuring out what positions JPMorgan actually held, and what positions might still be open. We might never know. The reason to point all this out is another great bit of research from FT Alphaville. As part of new proposed regulations on derivative trade in July, there is a move by regulatory authorities to increase the margin and collateral posting requirements on uncleared derivatives. Mostly this applies to systemically important financial institutions, otherwise called too-big-to-fail banks, and corporations that use derivatives for hedging are exempt. Since this started in the U.S. with a proposal from the Office of Comptroller of the Currency (OCC), it has now gone international. As FT Alphaville point out, the proposals are for uncleared swaps, which are less liquid, meaning less easy to sell. The interesting take-away from all this is that the OCC projects that about $2 Trillion in collateral would be needed, effectively removing that from other financial transactions. Usually large banks move ahead of regulations, so we may be seeing that necessary $2 Trillion being held on the side and not going to bonds nor stocks. That’s a huge amount of money to keep off bond and equities markets.
 Another popular market metric is the Volatility Index (VIX), which is a measure of implied volatility on the S&P 500 Index. This looks at options and futures positions. A high VIX indicates a great deal of pessimism in the markets, while a low VIX signals complacency. Outside of a few companies with sustained high implied volatility, there has been a slight decline in options activity recently. Again, FT Alphaville tries to give an explanation for low VIX. The important thing pointed out is that VIX is a better near term indicator than a long term forecaster. The great explanation found was that the Chicago Board of Options Exchange (CBOE) altered the calculation for VIX recently. So what we see at the moment is not yet a good indicator of when stock markets will shift. In the past we may have worried about a low VIX, but until we get into September it may not be an accurate indicator. However, if we see the VIX go over 20 and the S&P 500 goes into a sharp decline, then we might be seeing the start of a correction.
At this point, the low volume in equities markets does not indicate that the current rally is sustainable. As we have seen in a look at other investment areas and indicators, there remains some money on the sidelines for various reasons. Eventually that money may provide a real sustainable rally, but given the current economic conditions world-wide, I don’t think that time is near. The current rally is not wide spread, in that only some companies are near 52 week highs. If you hold shares in those companies, you might consider taking profits, if you are at a good level of profit. If you hold shares in companies that have not taken part in this run-up, or are generating solid dividend payouts, then you may want to wait and simply watch where the market goes. I tend not to play markets on momentum, and I have been called a bear at times, though being cautious has still allowed me to generate good profits. We might see 1450 to 1500 on the S&P, but without some changes in other areas where we watch the market, those levels do not look sustainable. It would not surprise me at all to see a correction (drop) of 10% or more over the next several months. Good luck, be cautious, and stay flexible.
G. Moat