Search This Blog

Monday, August 6, 2012

Housing Market Indicators


On the last day of July 2012, the most recent S&P / Case-Shiller Home Price Index data was released for May 2012. These Indices are calculated monthly using a three month moving average of data from 20 cities in the United States. There are further reports using 10 cities, and other reports for non-seasonal adjustments. Sometimes weather can be a factor in seasonal adjustments; as an example the recent mild winter across much of the U.S. likely contributed a disproportionate amount to increases. Though data recording for this began in the 1980s, based mostly upon repeated sales and behavioral finance, historical data was used to create an index as far back as the 1890s. In each sales transaction recorded, a search is conducted to find information on any previous sale. So this index does not look at new home sales data. San Diego is included in both the 10 city and 20 city index.

In this most recent report, we find that average home prices increased 2.2% from April 2012 to May 2012, for both the 10 and 20 city composites. Compared to May 2011, it was found that home prices declined 1.0% in the 10 city area, and 0.7% in the 20 city area. Spring and early Summer are historically stronger buying months, so keep that in mind with this two month improvement in data. The peak in all historical data was August 2006, and many of the cities in this index are still far below that level, with hard hit areas Phoenix over 50% below peak, and Las Vegas over 60% below peak. San Diego saw a 1.1% monthly improvement from April to May 2012, though average home selling prices are still 1.1% below the year ago period.

The housing market appears to be stabilizing, though we will need to see similar data over the next several months to confirm this possible trend. The third (Q3) and fourth (Q4) quarter of 2011 experienced a decline in average housing prices, while the early part of 2011 also indicated improvements similar to what we see in early 2012. While the hardest hit areas are showing improvement of supply and demand, the overall slowing economy could make continued improvement difficult to achieve. The number of underwater homes, representing negative equity or nearly that level, decreased to 28.5% of all residential loans in Q1 2012, compared to Q4 2011 levels of 30.1% underwater.

iShares Dow Jones US Real Estate
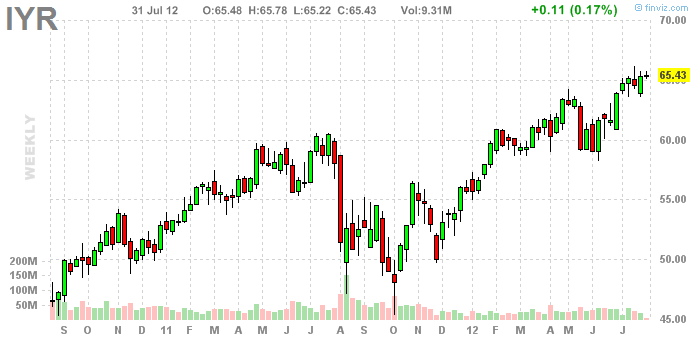
Since the Case-Shiller Home Price Index data is not released that often, investors may want to watch an interesting Electronically Traded Fund (ETF) offered through iShares, under the symbol IYR. This ETF attempts to replicate the performance of the Dow Jones U.S. Real Estate Index Fund, through holdings in companies involved in commercial and residential property. We can get an advance look into market trends by following this ETF, though the correlation of data to IYR is only near 65% accuracy over the last two years. Think of this more as a good short term trend indicator, rather than a longer term predictor. It’s important to follow developments in commercial real estate, since the amounts involved in most transactions are far greater than the residential housing market. While problems in the commercial real estate market are not necessarily a predictor of activity in the residential real estate market, a decline in that sector is likely to happen prior to a decline in residential markets. The main difference in the commercial market is that we are more likely to see work-outs of problem loans. Recently the Federal Housing Finance Agency rejected a request by the U.S. Treasury to write-down the principal of some underwater residential mortgages. The reason the FHFA stated for denying this move is they felt it would drive up the cost of a taxpayer bailout. Fannie Mae and Freddie Mac were seized by the U.S. Government after failing in 2008, mostly due to losses on sub-prime loans. Both Fannie and Freddie have received over $190 billion in funds to facilitate winding them down. The eventual hope is that the private sector will completely replace these government sponsored enterprises.

Housing was a much larger component of the overall economy prior to the recession. It is now less of an economic engine than in the past. In a way that may be better moving into the future, as the possibility of another housing bubble is far lower. That would mean more stable real estate markets without huge swings one way or the other. Consumer spending is responsible for about 70% of U.S. economic activity. Recently the savings rate increased to 4.4% even though household income increased 0.5% in June 2012, which suggests consumers are becoming more cautious and frugal. Without a significant improvement in the labor market, this trend may continue over the next several months. The increased savings is not a bad sign, though in a mostly credit driven economy, this activity is less likely to improve growth.

Financial Times Collateral Explanation
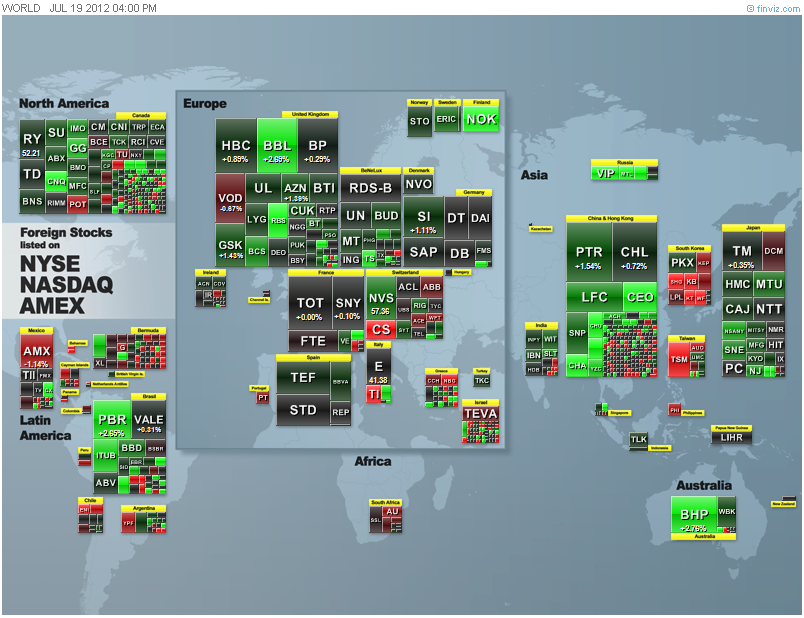
As mentioned in a previous article, the movement of money through banks, often in the form of the Carry Trade, can be a predictor of economic change, or even a predictor of loan availability. This relates directly to business loans, investment activity, commodity futures markets, commercial real estate, and housing. The Financial Times went through a great explanation of our current global banking environment recently (link to article in image). The main idea is that banks can predict the time value of money, in that loans are may to predict the need for funding of future goods and services. Under a conventional idea, as long as a population is growing, we can reasonably expect that demand for future goods show grow at least at the same pace. So inflation under this model would grow as population increases, under the assumption that money will become more available than goods and services. Banks have been able to lend based upon future scarcity of goods and services based upon their credit worthiness, mostly a reflection of their base capital holdings. Those who have read about upcoming Basel III rules and higher capital requirements for large banks may find more detail of interest, though for now I will save that for a future article. Until the establishment of Central Banks in many countries, banks operated under this model, and fared well unless they put forward too many bad loans, or in other words, over-predicted future economic activity. Heading into 2008 and the crash of housing markets and loan facilities, it appeared that banks had vastly over-estimated future economic growth. This left them far short of money, leaving many banks with too low of capital to initiate new lending activity. Asset write-downs and bankruptcies were inevitable, as we saw in late 2008 and early 2009. The Federal Reserve, as the Central Bank of the United States, saw this sudden change and initiated extremely low lending rates to large banks and financial companies. Partially this was in the hope of future banking activity improvement, because a central bank still functions much like the conventional banking model. If 2008 and 2009 had been a liquidity issue for banks, which caused the decline in lending, then we would have seen a faster recovery. While 2010 was a great improvement in the economy, it appears much of that was due to enhanced productivity, since lending activity remained constrained. When economic activity declined in 2008 and 2009, there were many inventory declines. Under the curtailed lending environment, corporations began to stock-pile money to use for future activity, mainly bypassing banks in the process. Corporations began to run more of their own lending and financial activity, often in the form of greater corporate bond issuance.

Fast forward to 1 August 2012, and Ben Bernanke of the Federal Reserve released newFederal Open Markets Committee meeting minutes. Lending rates to major banks and financial institutions are still held at 0.0% to 0.25% and expected to be this low through late 2014. The Fed notes that U.S. economic activity has somewhat slowed in the first half of 2012. Expectations are for moderate growth through the rest of this year. In the previous FOMC meeting, the Fed stated that they were prepared to “take further action”, while in this latest meeting, they stated: “The Committee will closely monitor incoming information on economic and financial developments and will provide additional accommodation as needed to promote a stronger economic recovery and sustained improvement in labor market conditions in a context of price stability.” Since the stock market was expecting more stimulus in the form of another round of Quantitative Easing (QE), when more QE was not announced, stock markets quickly started to sell off, and the U.S. Dollar Index climbed. Those who have followed the Australian Dollar (AUD) movements against U.S. Dollar (USD) movements, as mentioned in the previous article, would have seen the drop happen first in AUD/USD. Just to add to the turmoil on the day, Knight Capital Group, one of numerous Market Makers for equities markets, experienced a computer algorithm malfunction that caused volumes to increase suddenly and excessively in shares of 148 different NYSE listed companies. While Knight Capital Group did quickly correct this action, and erroneous trades are likely to be unwound, this morning trading issue placed the market on edge for the afternoon FOMC announcement.

It appears at the moment that the equities markets were expecting more stimulus. The recent increase began just over a week ago when European Central Bank President Mario Draghi stated that the ECB would use any and all means to shore up the Euro, and assist troubled economies in Europe. It was a bold statement, and global markets rallied on the hope of future monetary expansion. My feeling is that we will see this unwind further as the ECB meets with various finance ministers in Europe, and policy change proposals quickly run into a wall of bureaucracy. On 2 August 2012 the ECB will meet to work out details of Draghi’s proposals. At the heart of this is the idea of the ECB buying bonds directly from troubled economies, like Spain and Italy. This is similar to the Federal Reserve’s Operation Twist, which I discussed in a previous article. This idea was attempted with Greece, though when Greece partially defaulted, the ECB was unwilling to write-down those bond purchases, and the action unwound in the markets as other financial institutions felt they were being treated unfairly. This further constrained lending and credit markets in Europe, though large global banks headquartered in Europe did not shift activity to lending in U.S. markets. Part of the reason again was the constrained capital levels, and requirements by governments to increase capital levels. The idea of increased capital is that banks and financial companies would better be able to handle economic shocks.

Foreclosure Activity IncreasesThere have been some areas of improvement. New housing activity in the United States has risen slightly in the early part of 2012, though more recent activity is sharply lower. As mentioned above, favorable weather was one factor. Existing homes still account for nearly 90% of housing market activity, though new home sales accounts for building materials and construction worker activity. As we move towards a more favorable historical time for existing housing sales, the slowdown in new home sales indicates we might expectslower economic recovery heading towards the end of 2012. Housing research from RealtyTrac indicates that foreclosure activity increased in early 2012, compared to late 2011, in 125 U.S. metropolitan areas. Recently bankrupt Stockton, California posted the greatest foreclosure rate at 2.66% with 6218 units facing foreclosure. The greatest increase in foreclosure activity has been seen in Atlanta, with 46,267 units in foreclosure. Some areas did decrease foreclosure activity, with San Diego posting 11% fewer foreclosures than the year ago period. To add some context to this information, the 30 year mortgage rate reached a record low of 3.49% in late June 2012.

At the moment it appears that despite record low mortgage rates, traditional bank mortgage lending is still constrained due to macro-economic factors, deleveraging, and increased capital requirements. While equities markets expected more stimulus in the form of further Quantitative Easing, our take-away is that the perceived need for QE and other stimulative measures, is that the current economy is not quite strong enough to stand on it’s own. Real economic growth appears negative once we remove the influence of previous economic stimulus. Corporations have been using other forms of funding as banks constrain lending, and we may see similar moves amongst smaller companies, and perhaps even in the housing market. While all these factors may suggest we have hit a low in housing markets, caution is advised moving forwards. We will need to continue to watch economic activity indicators, labor markets, and potential action by Central Banks heading to the end of 2012.

G. Moat

Other Than Real Estate


Since early June the S&P 500 has rallied nearly 8% making it seem like stocks might have bottomed, and may now be headed towards new highs. If you only looked at the Dow Index, S&P 500, or NASDAQ, then you might be lulled into a false sense of confidence. With equities (stocks) going up globally lately, how can we tell if it is okay to dive back into the market, or if we should be more cautious? In this article we will explore a few helpful indicators, which will make your investment decisions more informed.

World Equities MovementsFinancial Vizualizations is a great resource tool for a quick look at equities markets. Whether stocks moved up, indicated by green, or down, indicated by red, a glance at that website will give you the story of the day. The default is for a daily view, though if your investments tend more towards long term, then viewing the year-to-date or monthly Data may be a better choice. The World Market view only shows foreign companies shares listed on U.S. Stock Exchanges, usually called ADRs (American Depository Receipts), though sometimes called ADS (American Depository Shares). Over the last few years, global markets have often moved in step, with around a 90% correlation between major market moves. Each day markets open first in Japan, Australia, and parts of Asia, then later in the day in Europe. When the markets open in New York, most European markets are still active. There is also after hours trading in nearly all these markets, but the lower volumes mean that less change will be noticeable. Sometimes a down day in New York markets can lead to a down day in Asian markets a few hours later. Always check the longer term data, which can be more useful for trend spotting than the daily view data.

S&P 500 Heat MapThere is also an S&P 500 grid view, split up by sector, so you can see whether one sector drove the markets more than another. Once you are on FinViz.com, you can zoom in to individual areas to easily view specific companies share performance. Switching from day view, to month, year-to-date, or longer, can give you a better way to judge trends. When you notice one sector consistently moving more than another, then overall market moves tend to make more sense.

There are other reasons for the high correlation movements, though some of them are not really that intuitive. The largest institutional investors, comprised of sovereign wealth funds, large hedge funds, and global financial organizations, like the largest banks, comprise most of the daily trading volume in the major equities markets around the globe. The majority have trading desks that operate around the clock, sometimes only stopping from the Friday close of New York markets until the Monday morning opening of Asian markets. Besides movements of stocks, those large institutional investors are active in currency trading, known as Forex, and commodities trading.

Forex trading involves the buying and selling of currencies. It is essentially a range bound technical trading environment, often moving on news, though sometimes moved by large institutional investors. It is difficult to get accurate volume data without watching several dedicated trading platforms, though the platform I use gives an idea of major movement trends. Each day the largest movements are usually in the Euro (EUR) and U.S. Dollar pair, expressed as EUR/USD or more simply the exchange rate of those two currencies. This moves throughout the day, and is different than the rate a bank will give you when you walk in to exchange currency. The reason for the EUR/USD pair being the most heavily traded is that EUR are needed to buy European equities and European bonds, and USD are need to by U.S. listed equities, U.S. Treasuries, and to trade commodities futures, like crude oil. The U.S. is the largest issuer of debt, in the form of U.S. Treasuries, though closely followed by several European countries. In the United Kingdom, the Pound (GBP) is still in use, though oddly enough the GBP/USD is not the second most traded pair of currencies. That distinction goes to the Australian Dollar (AUD) on most days. The reason the AUD is so heavily traded is that it is a commodity play, due to the coal, iron ore, and natural gas export market there. An interesting more recent trend with the AUD/USD is that movement direction has a high correlation with the S&P 500. While the magnitude change can vary, the direction trend usually appears in the AUD/USD first. When you see the AUD/USD pair decline, you can usually expect the S&P 500 to decline, and the converse is also true for uptrends. Compare the 3 month AUD/USD with the S&P 500 to the 3 month EUR/USD with the S&P 500, then you can see how AUD/USD is a better leading indicator.

Some of the reason behind this correlation is due to what is known as the Carry Trade. There are several aspects to this, but the main idea is borrowing money in one country, then investing it in another. Sometimes the investment is through the bond markets, through the purchase of sovereign debt issued by a country. Among very large eligible institutional investors, the Discount Window is the mechanism of borrowing from the central bank of a country. You may see that referred to as the Prime Rate, or Primary Dealer Credit Facility in the United States. Obviously the average retail investor cannot make direct use of the Carry Trade, but it is responsible for much of the flow of funds around the globe. As retail investors, we are just along for the ride with the largest institutional investors, but through establishing an investment strategy, watching correlations, and sticking to our game plan, we can become more profitable in our investment decisions.

One of the more interesting indexes a self-driven investor can check at the end of each day, is the SPXA50R, or more simply the percentage of stocks listed on the S&P 500 that are above their 50 day moving average (50dma). There are also variations of this chart for the NYSE and NASDAQ, though with the S&P representing 500 companies, it is a better big picture viewpoint than other indexes. You can explore and compare those other similar indexes at StockCharts.com, including variations that use a 200 day moving average. The difference in using the 50dma over the 200dma is that the 200dma represents a longer trend, and it is easier to pick high and low points on the 50dma chart. While the market is moving down, it is tough to only use SPXA50R as a buying indicator, though usually if you are buying shares when this index is under 20, you are probably near a low point. Where this is more useful is knowing when to sell shares, and when to take profits. When you see SPXA50R go above 85, then you may want to check your investments, then decide if you want to take profits. Obviously individual company shares may not move exactly with this index, but it can provide a great market overview. The downside of this index is that you may find only once or twice a year when a market high or market low point is reached, and individual companies will not always match market moves. Use this in combination with your research, and company events, including earnings reports and major revenue change announcements.

10 Year Treasury Rate Chart

10 Year Treasury Rate data by YCharts

As mentioned in the previous article, U.S. Treasuries are one of the most traded Safe Haveninvestments. This can also be one of our most useful indicators. While the Federal Reserve is still running Operation Twist, the yield has been pushed quite low on a historical basis. Despite that, the demand for Treasuries is still high. On 19 July 2012 the 10 year Treasury Inflation Protected Security, or TIPS, hit a record low yield of -0.627%. A simple idea behind TIPS is that there is a fixed payout rate, which is adjusted based upon the Consumer Price Index (CPI). So if the CPI indicates inflation, then the payout above the fixed rate increases. If the CPI indicates we are experiencing deflation, then the TIPS payment would decrease. When we see record low yields on any Treasuries, then we do not really have a sustainable market rally. Considering that TIPS are not part of the Fed’s Operation Twist, this is an indication that safe haven investment demand is still very strong. Checking the yield on the 10 year Treasury can be one of the quickest and easiest ways to see if markets really are turning around, or if a rally in stock markets might be a shorter term trend. Until safe haven demand declines, stock markets could quickly and easily turn around and decline.

In recent Argus Market Watch reports, other indications lead us to believe that current market sentiment is negative, despite the gains since early June. Vickers Stock Research noted corporate insiders selling their shares 3.3 times more than they were purchasing company shares. Insider buying can be a better individual company indicator than insider selling, but when sentiment is negative and growing, it can be tough for a rally to become sustainable. Argus Market Watch also note a recent widening of corporate bonds yields compared to Treasury yields, though they do not expect an increase in the corporate default rate. Fitch Ratings noticed a similar trend in Europe, as bond issuance outpaced loans for large corporations. Fitch reported that bonds comprised 52% of funding in the first six months of 2012, compared to 29% in 2011, while noting that this ratio of bonds to loans has increased every year since 2008. One reason for this is the relative safe haven status of highly rated corporate bonds, compared to sovereign bonds and bank bonds, though banks deleveraging are another reason behind the low loan issuance numbers. Fitch Ratings, in another report, places the U.S. corporate default rate at 2.2% for June 2012. This compares to an average corporate loan recovery rate of 72% over the last 12 years.

Commercial Mortgage Backed Securities, or CMBS, trade much like bonds, and are covered under a separate criteria of corporate ratings. Fitch Ratings currently maintains a stable outlook for 83% of issued CMBS, with 9% considered distressed, and a negate outlook for just 7% of CMBS. The latest default rates are Multifamily: 11.64% (from 11.35% in May), Hotel: 11.22% (from 11.15%), Industrial: 9.93% (from 10.00%), Office: 8.58% (from 8.64%), and Retail: 7.67% (from 7.45%). A recent news item puts this in perspective. The Blackstone Group, one of the largest private hedge funds in the world, spent $300 million to purchase over 2000 foreclosed homes to place onto the rental market. This is a huge bet on a recovery in the housing market. The Blackstone Group is not the only financial company making such a move, though so far this is the largest single move into the rental housing market. Since the Blackstone Group has many diversified investments in major companies, the futures markets, commodities, and Forex, this move shows that even some of the largest investors want some diversification.

At a minimum, like any investor, we want to get a return that is greater than the rate of inflation. Ideally we want to gain much more than that, increasing the value of our investments. There will always be times of uncertainty, and there is nothing wrong with sitting, watching, and waiting. As individual investors, we have no pressure to make moves every day. We can choose when we want to buy or sell, and in which directions we want to invest. It is always a good idea to be flexible in our choices, with some funds set aside in Money Market, bond fund, or just as cash, to take advantage of buying opportunities. Hopefully with some of the indicators I pointed out in this article, we can also make more informed decisions of when to move into investments, and when to take profits.

Investing is never without risk, so readers are encouraged to do their own research, check many sources of information, and determine the path of their investments. We hope the information we provide will be a launching point for that research, and point you towards the path of being an informed and successful investor.

G. Moat

Monday, July 9, 2012

Macro-economic Trends And Safe Haven Investments

After several years of market swings, at times it can seem that searching for a safe haven investment might be the best choice. Managed accounts, such as many mutual funds, often with highly regarded firms and prominent names, failed to move to avert or minimize losses during the market downturn of 2008, and the sell-off of 2009. Even Money Market funds were not immune from failure, as dramatically shown with the Reserve Primary Fund “Breaking the Buck”. Money market funds seek to return a minimum net asset value of $1 for every $1 invested. In the 37 year history of such funds, only three funds ever broke the buck. The Reserve Primary Fund invested in asset backed commercial paper and U.S. Treasuries, though some of that asset backed commercial paper was issued by Lehman Brothers. When Lehman Brothers filed for bankruptcy on 15 September 2008, the Reserve Primary Fund had to write-down the debt owed by Lehman Brothers. This caused the fund to drop to 0.97¢ breaking the buck, forcing the fund to close. To this day, despite the Securities and Exchange Commission filing charges against the managers of that fund, former investors in the Reserve Primary Fund are still awaiting some form of compensation payment.


Since that supposedly Safe Haven investment downfall, the U.S. Treasury created an Exchange Stabilization Fund (ESF) as a form of insurance for Money Market Funds. Investors who have funds in a Money Market account are encouraged to see whether or not their Money Market holdings fall under this protection. The events in late September 2008 and early 2009 led to a short run on some money market funds, as investors sought to withdraw their holdings. Most money market funds at the time liquidated their commercial paper holdings in order to pay redemptions. Commercial paper loans have been used by many businesses and corporations to finance short term activity, often with new commercial paper being issued to partially pay previously issued commercial paper, rolling over short term debt. Since money market funds were the largest investors in commercial paper loans, the sudden increase in redemption demands caused a lock-up of the commercial paper financial market. Companies unable to roll over debt, and short on cash to pay maturing debt, found themselves in a severe liquidity crunch, unable to find short term funding at any reasonable rate.


During that time, and still to this year, Money Market Funds moved more towards purchasing U.S. Treasuries. The demand for U.S. Treasuries is still so high that the yield is now quite low. A look at the most issued note, the 10 year U.S. Treasury, indicates the yield has fallen to under 2% and recently less than 1.6%. If the value of the U.S. Dollar (USD) falls more relative to other currencies over the next ten years, then the real return would be negative. While U.S. Treasuries may seem a safe haven in uncertain times, the Federal Reserve through Operation Twist is complicating the ability to gain a positive return over time. The real return on Treasuries is now lower than the rate of inflation.


Operation Twist involves buying long dated Treasuries and selling short dated Treasuries, with the hoped affect of lowering long term interest rates, while raising short term interest rates. Buying more Treasuries lowers the yield, effectively reducing the interest paid over time. With the Fed Funds Rate now at 0.00% to 0.25% through at least 2014, selling more short term Treasuries should lower the price, which should increase short term yields. Unfortunately with Quantitative Easing 1 and 2 (QE1 and QE2), the Federal Reserve already bought short term Treasuries, which gave them an excess supply. The market knows this all too well, so the intended affect is not working, making the yield on 2 year Treasuries near 0%. Operation Twist was recently extended until the end of 2012, making U.S. Treasuries much less appealing investments.

Some considered QE1 and QE2 as money printing, and indeed there was an increase in money supply, but only a portion of it. Under our fractional-reserve system, when banks issue loans, new sums of money are created. Recall that the short term loan market essentially dried up, so when QE1 and QE2 were initiated, the affect was barely felt in markets. The USD should have been devalued by the actions of the Fed, yet the efforts of QE1 and QE2 barely changed the value. There was a more direct affect of exchange rates, as large investors sought returns in other countries. Demand for German Bunds, or other sovereign investments in Europe, created a demand for Euros (EUR) for a time, which lowered the value of the dollar (USD). Now with growing troubles in Europe, and politicians dragging their feet on creating real solutions, the demand is shifting the other direction, and the USD is gaining in strength. In the near term we may see the EUR drop more against the USD, possibly under 1.20. This can present a buying opportunity for investors wishing to initiate investments in large international corporations who happen to be headquartered in Europe. In the longer run, over the next several years, Europe will eventually solve some of their current issues, and nimble companies there will learn how to work around the feet-dragging to generate revenues.


We may indeed see QE3 and some form of that from the European Central Bank, though I think long term investors should not consider these possibilities with a high degree of certainty. The issue behind loose monetary policy is that eventually the excess money printing will need to be recovered, and the few tests we have seen of how that will be accomplished have not looked very promising. Ideally the rate of inflation would match the rates of population growth, so that the economy could expand at the rate that ensures price stability. History has proven that this has not been precise, and as we saw in the last bubble, central banks can get policies completely wrong, which prompts a reset of the economy. Places with slow population growth, or low immigration rates limiting population growth, have shown low economic growth over long periods of time. Japan has been locked in a slow growth cycle for over a decade, and is now facing deflation, despite numerous efforts by their central bank to loosen monetary policy. The United Stated and Europe should not ignore the policy decisions of Japan, or they will be more likely to repeat them. The result of these policies is that we now see more growth in emerging economies than in developed economies. This is likely to continue for quite some time into the future.

When we look at investment opportunities in emerging economies, we sometimes find what seems to be higher risk, through geopolitical uncertainty, and at times due to a lack of currency stability. People in emerging economies tend to want better food, and there is a need for more energy resources and raw materials. Sustainable growth can run for long periods of time, if governments remain somewhat stable and do well managing their resources. China and India have become great consumers of raw materials as they build infrastructure and become more urbanized. The places in the world that supply the energy and raw materials that allow China and India to grow at a fast pace, helps drive the economies where the oil, natural gas, and raw materials are located. Australia has a booming mining industry, which exports large amounts of iron ore and coal, mostly to China. This demand has driven the Australian economy and caused the Australian Dollar (AUD) to strengthen against other currencies. Brazil, with large mining resources and oil, is also experiencing a strong export driven economy. Chile, with some of the world's largest reserves of copper, and rich in easy to access lithium reserves, has started to grow at a faster pace, somewhat helped by a more stable government. Chile also holds large reserves of minerals useful for fertilizing crops, though they are somewhat matched by a more stable Canada in that regard. Much of South America is experiencing expansion, mechanization, and modernizing of farm lands, with exports of food and grains generating increasing revenues. Short of creating more bubbles in their economies, the United States and Europe are unlikely to see the growth that emerging economies are now enjoying.

There are also frontier economies, and some large multi-national corporations are setting up in those countries, with the hope that they will become the next emerging economies. Over the last few years I have watched a great increase in oil and natural gas exploration in west Africa, and greater mining activity in other inland areas of Africa. Many of these places are not completely stable, nor do they have established central monetary policy to create long term sustainable economies. These places are much higher risk as direct investments, though it is possible to lessen the geopolitical risk through investments in corporations now working to develop these areas. Offshore oil is probably the best example of that, as Middle East tensions are causing many of the oil majors to look at developing resources in other locations. Since oil is priced in USD in most of the world, the financial stability of local economies can have a negligible affect on operating in those parts of the world. Offshore oil development is a highly specialized realm, and difficult for emerging economies to operate on their own. Even Brazil, an emerging economy with a long history of oil production and exploration, still need outside technology and companies to provide the most profitable and efficient production.


Over a long investing time period, in an actively managed portfolio, we can look at macro-economic trends around the world, and position our investments to capitalize on future areas of growth. When calculating risk, we need to be flexible, and have some of our assets positioned for more stable and predictable returns. Maintaining a cash position is important for some of that flexibility, and that can be in money market funds, bond funds, or Treasuries. Since we know the Federal Reserve will continue Operation Twist through the end of 2012, direct investments in Treasuries are unlikely to provide good returns for now, though if we look at funds that buy Treasuries, we can be more flexible moving money in or out of those funds. With the establishment of the ESF to back money market funds, most of those are also a good choice to park cash. In our investments, it may be tempting to jump onto shares of the latest company to make the news, but a longer term investment plan, backed by research into companies with good future growth prospects, may provide better long term returns.


We would be lucky to get in at the bottom of the market, or take profits at the top of the market, so making a choice of the size of a holding, and buying near a low point, should be easier to attain goals than trying to hit exact high or low levels. One thing that can help longer term investors is to acquire shares of companies that pay solid dividends. At the moment companies that pay more than 2% dividend yield are outperforming 10 year Treasuries, while some companies are generating more than 4% annual dividend yields. There are other investments outside of bonds and equities that pay fixed returns, and may be a good choice in diversified portfolios. Given the recent bankruptcies in Jefferson County, Alabama, and Stockton, California, I suggest avoiding small municipal bond investments. Even the debt of some countries should not be considered as a safe haven, nor risk free, as witnessed in the forced write-down of over 75% of Greek debt. Moving some investments to fixed return provides one source of revenues that are easier to plan over time than simply relying upon profit taking from stocks.

In future articles in this newsletter, we will look more in depth at some of the macro-economic trends identified in this article. Investing is never without risk, so readers are encouraged to do their own research, check many sources of information, and determine the path of their investments. We hope the information we provide will be a launching point for that research, and point you towards the path of being an informed and successful investor.

Saturday, June 30, 2012

What Does Morgan Stanley Know???

Morgan Stanley predict a 5% to 8% decline in home prices between the fourth quarter of 2013 and the first quarter of 2014. What do they know? I think that they might be on to something.

They predict that retail home sales prices will fall 5% to 10%. They think that this has something to do with the feasibility of getting a mortgage along with the measures of affordability of our population.

Fannie Mae's economic research team put out a new report as well that predicts that home prices will reach bottom in 2013.

In Morgan Stanley's report they say that even thought there is a constant "household formation", the only choice that most households have is to rent. Even though there is demand for people to buy real estate, the inhibited mortgage credit availability is what is keeping people from buying. For investors, there is a high demand for rental properties because everyone needs a place to live. Think about it, if you can buy a rental property right now, rent it out and get over a 2% return on your money, then you are beating what the banks are giving you on any secured investment. Another option is to go to the stock market where your investment is collateralized with shares of a company that can go belly up any day, or you can buy commodities like Gold and hope that the price goes. The problem with commodities is that you don't get any monthly income, you only make money when you sell. In May, Bank of Americasaid the homeownership rate will normalize to 63% and remain there, pulled down by the continued flow of foreclosures. The national homeownership rate stood at 65.4% in the first quarter, falling 1% from a year earlier and 0.6% from the previous quarter, according to the U.S. Census Bureau.

“We are bullish on rental housing,” analysts at Morgan Stanely said. “In our view, the incremental demand for shelter will be largely met by rental housing. The homeownership rate, which has sharply declined over the last few years, is unlikely to revert to the highs attained during the middle of the last decade.”


http://sequ.com

Friday, March 2, 2012

Warren Buffett’s Investment Advice Is To Buy Houses


Warren Buffet was on CNBC a few days ago and he said that he would buy "a couple hundred thousand" single family homes if it were practical to do so.

Let's break down what it means to own a property right now in San Diego. First of all we need to look at the historic prices of houses here. Please see the Case-Shiller chart below of the HPI (House Pricing Index) from 2000 until 2010;


Unfortunately, I could not find a chart that was updated up to 2012 from 2000 but I did find this chart that just came out with Case-Shiller data that shows where the market has gone from 2005 and on.

As you can see, the prices have dipped since the middle of 2010. Right now, house prices are roughly the level that they were at in the middle of 2002. Many people think that if they buy a house right now, it's as if they bought it in 2002, but most people forget that interest rates in mid 2002 were at about 7% for a 30 year fixed. Our current interest rates are below 4% for a 30 year fixed or 40% less than 2002 rates. So if you buy a house to live in, it will cost you a little more than half the price it did then. What that translates to is almost half the mortgage payment. For someone buying a property to live in, this is great news.

If you are buying a property as an investment, right now is a great time as well. For the past decade we have seen a mere 1% increase per year in rent since 2002 (according to commerce statistics, adjusted for inflation). I believe that the rental market has been depressed because it was so easy to buy a property during the "boom" time of real estate, that is when vacancy rates went up in San Diego. When the "bust" of real estate came, we saw young adults not being able to afford to live on their own anymore and this kept the vacancy rates up. According to Peggy Alford, president of Rents.com, more than 1.2 million of them moved back with their parents from 2005 until 2010 and many others doubled up together. In order to curb the depressed demand for rentals, landlords had to provide rent concessions such as a period of free rent in order to win leases. Now that the economy has started its recovery, many of these young adults are starting to look for a place to live again as renters rather than owners. They have seen so many of their friends and family suffer from foreclosures and short sales. The memory of the heartache is fresh in their minds.

As good as this all sounds for the rental market, the predicament in which we find ourselves is that we are in the bottleneck in financing. If you are one of the select few that qualify for financing, you are able to take advantage of this situation. Here are a couple of examples of the deals that I have recently funded;

Studio Condo in West Point Loma
$71,000 - Purchase Price
$255 - Monthly HOA
$74 - Monthly Taxes and Insurance
$1,050 - Rent
---------------------------------------------
$721 - Monthly Positive Cash Flow
12.2% Return on Invested Funds

3 Unit Property in Lakeside
$156,000 - Purchase Price
$30,000 - Rehab Costs
$162 - Monthly Taxes & Insurance
$400 - Monthly Utilities
$2,875 - Monthly Rent
---------------------------------------------
$2,313 - Monthly Cash Flow
14.5% Return on Invested Funds

These are the two best examples of great cash flow properties. Although these were purchased with cash, if one were to get financing on these properties, the return would increase.

http://sequ.com

Thursday, March 1, 2012

Completed La Mesa Flip

Hello All,

Here is the completed flip that was purchased in November

You can see the link to the original post here;

http://pfllc.blogspot.com/2011/10/new-flip-in-la-mesa.html

As you can see the property looks vastly different now then it did before. The original plan was to build a bedroom and bathroom onto the property in order to really increase the value and when the borrower was in the process of getting permits, he decided that it was more trouble than it was worth. Unfortunately, for the borrower, there was some wasted time while he was attempting to get permits for this property and was paying interest during that time.


http://sequ.com

Thursday, December 1, 2011

Completed Rehab in Spring Valley

If you are reader of my blog, you will know that our main business is hard money. When I do a hard money loan, I am always thinking of the worst case scenario; that one of my clients is not going to finish the job and I'm going to have to complete the rehab in order to sell the property or rent it out.

I think that everybody needs to put their money where their mouth is so what I decided to do is to buy a distressed property and do a rehab project myself from A-Z. Here is the deal that I put together;

$262,000 - Purchase Price
$49,258.25 - Construction Costs
$449,000 - List Price


The property is a 2,642 square foot single family home. This house consists of 5 bedrooms, 3 bathrooms and an office/optional bedroom. The property was built in 1997 but was very abused since it was built. This lot is zoned RS4 meaning it is zoned for four units. The house has a detached garage that has been converted into a 2 bedroom 1 bath house that can be easily converted back into a garage. This property has an incredible 270 degree view as well.

This property sits on a 55,000 square foot lot (1.27 acres). Most of the time when I see that there is a property with such a large lot, the case is that the lot is not buildable. This particular lot is graded and sits below grade of this house. In theory, if you were to build another house on that lot, you would not be side by side with your neighbors. I like these types of properties because the buyer has the opportunity to possibly subdivide in the future and either build another house or sell the lot. The lot that is attached to this house would sell for $50,000 right now but much more in the good times. This is a potential retirement plan for the person that decides to buy this house.

Here are some pictures of the completed product;


http://sequ.com

Sunday, October 23, 2011

New Flip in La Mesa

Here is a new project that is about to receive funding. The rehabber is buying this house as a short sale. He is utilizing leverage from me in the form of a hard money loan.

This property is currently a 2 bedroom 1 bath house. The rehabber is planning to add a master suit and bedroom to this house. Making it about 1,300 square feet when it's done.

The purchase price is about $175,000 and I am doing thew hard money loan at about 80% of the purchase price or $140,000. The rehab is should cost approximately $50,000 and will take about 4 months. I estimate that this property should sell for about $330,000 when it's done.

There is one thing that I really like about this property that does not show on paper but I'm sure will show on the MLS when the property goes for sale. This particular property is zoned for 3 units. I like these types of value adds because it give the perspective buyer an opportunity to make money on the back end. When someone buys this house, they will know that in the future they will be bale to do more with this property. These days no one know what is going on with their retirement plans or pensions, properties like this give the buyer an alternate source of future income.

Take a look at these picture of the before;


Monday, October 17, 2011

I Survived Real Estate 2011 - Appraisal Issues

Last Friday I had the pleasure of attending the "I Survived Real Estate 2011" meeting that was organised by Bruce Norris.

First of all, I have to say that Bruce Noris and his team really do a great job of putting together information and asking the questions that everyone has on their mind. Bruce Norris has a hard money company that is in Irvine that does a lot of the loans that I do, they also have a loan program that they extended to the public where they give loans for 8 years at a lower interest rate with higher points (kind of the opposite of what I do). Even so, at any event that I go to where Bruce speaks, he never pushes his product and I must really commend him for that.

The reason for this blog post is to address a certain topic that was barely touched on by Shaun O'Toole from ForeclosureRadar.com (great site for anyone that is interested in learning about trends of foreclosures or looking to buy properties at the auctions). At the end of the whole evening when the panelists were asked about what they would like to see happen in real estate this upcoming year, Shaun stated that the whole appraisal process is completely screwed up and I agree with him. He stated that if you go into a market where there are no comparables for an appraiser to pick out, they pick the closest comps that they can get and a lot of times the values don't make sense. His idea was to comp out properties not by other sales but by the cash flow that they produce. If you can make sure that the property cash flows with the market rent, then you can decipher the value from the rent that the property will produce. I don't necessarily agree with him on the whole idea but if someone is willing to buy a property based on the cash flow at a certain price, there should be some sort of variance that you can have on the appraised value.

I was just affected by this issue on a certain multiple unit property that I was selling. We went through the whole inspection, appraisal and walk through process and the buyer was completely satisfied with the sale. When the appraisal came back, it came back lower than the sales price and it put a hitch in our sale. Now this property is superior to any comp that the appraiser had on the appraisal report but because there was a value discrepancy according to some HACK appraiser, the buyer was thinking to back out of the sale.

The buyer was agreeable on the sales price based on the market rents of the units and the cap rate until the appraisal came in. This particular property was completely superior to other multi-unit properties in the area yet the appraiser could not bring the value up. There should be a 2% variance on the allowable discrepancy between the appraised value and the purchase price. When you go to buy a car, the loan company has an allowable 20% variance on the purchase price and that is just on a car. When you are buying a property that is in some cases close to a million dollars, you can't stretch even $10,000. This is ridiculous.

If the case is that the appraiser knows EXACTLY what properties are worth what do you need real estate agents for? Why doesn't someone that is selling a property just get an appraisal and put that appraisal in the classified section? The seller can save 5-6% on commissions that way and there is no second guessing what the property will appraise at.

The other problem is that if a bank orders an appraisal, they are held to the  "Home Valuation Code of Conduct" or HVCC. According to HVCC the bank must use a third party company that will order the appraisal for the bank. The bank can not contact the appraiser directly as well as anyone else that is in the transaction. The company that is responsible for picking the appraiser only have a certain amount of choices to pick from (appraisers that have signed up with them). Most of these companies will not give the same appraiser more business than the others so what they do is switch appraisers that they send requests to so that everyone gets their fair share (kind of like communism). What ends up happening in many cases is they pick appraisers that are not from the area to appraise properties. If you are sticking with the current appraisal system, this presents a problem because it's really easy to overlook the railroad tracks that the appraiser is crossing.

In my business, this is not a big deal because most of it is hard money loans but I feel bad for my clients that are rehabbing properties because they are at the mercy of this royalty that we call appraisers.

Thank you for lending me your ear, or rather your eyes, and entertaining an issue that I'm sure many of you have run into.

I would lime to thank Michael Khunis for lending me some ideas for this post.

Sunday, October 16, 2011

Completed Casita

Now I have been using the word "casita" very liberally for this particular property. According to dictionary.com this is the formal definition; 

Casita - A small cude dwelling forming part of a shantytown inhabited by Mexican laborers in the southwestern U.S.

WOW was I incorrect for calling this thing a casita all this time!!!! 

This is a really attractive 570 square foot craftsman style house that is located in Normal Heights. This thing was very unattractive when I went to make the loan. It was in desperate need of repair, especially the foundation. 

Here you can see my previous post for this thing; 


The property is in escrow now and it looks great. This thing is really charming and will be a great purchase for the next people that plan to live in it. 

Take a look at the after pictures, the rehabers really did a great job fixing this property. 


Wednesday, October 12, 2011

Completed Flip in La Mesa

A few months ago we took on a project to flip ourselves. Although I am in the hard money business and don't really take on many flips, when a "home run" property comes up, I can't help myself but to latch on to it (this was one of those deals).

The property was purchased for about $370,000, we put about $70,000 or work into this place. The property went on the market for $650,000 about a month ago and is in escrow now. 

I'm going to keep this blog posting short because the last one about this property was fairly long winded. 

Please see the completed pictures below;